An invited chapter from Professor Michael Anderson of the University of Edinburgh with a contribution from Nick Wright of the General Register Office for Scotland.
Introduction
As in earlier years, the principal focus of most of this year’s Annual Review is a summary of the current demographic situation of Scotland as a whole, mainly set within the context of recent and longer-term trends. Only a limited amount of text is normally devoted to differences between different parts of Scotland, and very little of this is concerned with change over time. While the background statistics made available to accompany the text often include data tabulated by Council and NHS Board area, this is usually only done on the basis of the current year’s data.
The main purpose of this chapter in the 2006 Review is to bring together some of these sub-Scotland figures to offer a more comprehensive picture of variations by Council areas (these areas are mapped in Figures 2.2a & b and Figures 2.9a & b) and to explore how key elements of Scotland’s local demography have changed over the past 20-25 years. To reduce the impact of short-term fluctuations and random variation caused by low annual numbers of events, we have used data for five year periods, focusing primarily on contrasts between 1981-85 and 2001-05, but with data for intervening quinquennia normally available in the reference tables on the website. The reference tables also provide all the numerical data from which the graphs and maps illustrating this chapter have been derived.
The chapter focusses on the past 20-25 years. Tables 2.1, 2.2 and 2.3 look at the difference in population in individual years between mid year (30 June) points five years apart. For Figures 2.1 to 2.12, 2.14 and Table 2.4, the data used are an average of data for either or both of the five year periods up to the end of 1985 (referred to as 1981-85) and the end of 2005 (2001-2005). For Figures 2.13a to 2.13d, the data are an average of the five year period between the start of the 2002 calendar year and the end of the 2006 calendar year.
Of course, most Scottish local authorities are far from homogeneous internally. Many primarily rural areas also contain towns, a few of considerable size. Many of the more urban areas combine some districts with more prosperous populations and others which are predominantly occupied by more deprived sections of the population. There are also some areas, notably West Lothian and to some extent Midlothian, which combine new relatively affluent suburban and city-feeder development with older areas still dominated by people who had been active in the former heavy manufacturing or extractive industries. The three eastern city Council areas – Aberdeen, Dundee and Edinburgh – are not only heterogeneous internally, but are closely linked in demographic terms to neighbouring authorities to which families move as they become established in middle stages of the life course, and from which large numbers daily commute for work in their respective city cores. Also to be noted is the impact of relatively high concentrations of armed forces personnel in the air-force stations of Moray and the naval bases of Argyll and Bute.
While it would have been possible to break down local authorities into smaller and socially more homogenous units, we have chosen not to do this here. Council areas have a political reality and it is at this level that most political and administrative initiatives would need to be taken to deal with some of the areas of concern highlighted by this analysis. There are also advantages of consistency in analysing data for the same areas, and the further benefit that for all topics except migration we are able to do so using data which tracks current Council boundaries back to the early 1980s. Finally, local authority areas are big enough to minimize the impact of short term and random fluctuations. Those who wish to see some discussion of lower level analysis of mortality are encouraged to look at a recent Medical Research Council report (A. H. Leyland et al, Inequalities in mortality in Scotland, 1981-2001, MRC Social and Public Health Sciences Unit Occasional Paper no. 16, February 2007).
Population change
Between mid-1981 and mid-2006, Scotland’s population declined from 5.180 million to 5.117 million, a fall of 1.2 per cent - as the first line in Table 2.1 shows. In the early 1980s, the population was falling slowly and it continued to do so until 2001-02. It is estimated to have risen by 52,700 between mid-2001 and mid-2006, an increase of about 1.0 per cent.
But, as the rest of Table 2.1 shows, there were major differences between Scotland’s Council areas. In the years between 1981 and 2006, growth was especially concentrated in city suburbs, notably Aberdeenshire, East Renfrewshire, West and East Lothian, all of which grew by more than 10 per cent, with Aberdeenshire rising by over 25 per cent. There was also significant growth in some rural areas, particularly Perth and Kinross (15 per cent), Highland (10 per cent) and Scottish Borders (9 per cent).
By contrast, much of the heartland of industrial and commercial West Central Scotland saw a continuation of earlier decades of population decline, most notably in Glasgow City itself and in Inverclyde and West Dunbartonshire, all of which fell by more than 10 per cent, as also did Dundee City. There was also a major reduction in population over this period in Eilean Siar and the Shetland Islands, and smaller falls in Aberdeen City, South Ayrshire and in most other parts of West Central Scotland1. As Table 2.1 also shows, in almost every case similar patterns can be seen if we confine ourselves simply to the first and last five years of the period, though a particularly strong feature of the last five years was modest growth in City of Edinburgh and all its surrounding areas, except for Midlothian but including Fife and Scottish Borders.
Table 2.1 Population Change by Council area, 1981-1986 and 2001-2006
|
Population at Mid year 1981 |
Population at Mid year 1986 |
Percentage Change1981 to 1986 |
Population at Mid year 2001 |
Population at Mid year 2006 |
Percentage Change2001 to 2006 |
Change 1981 to 2006 |
Percentage Change 1981 to 2006 |
|
|---|---|---|---|---|---|---|---|---|
|
SCOTLAND |
5,180,200 |
5,111,760 |
-1.3% |
5,064,200 |
5,116,900 |
1.0% |
-63,300 |
-1.2% |
|
Council Areas |
||||||||
|
Aberdeen City |
212,490 |
217,080 |
2.2% |
211,910 |
206,880 |
-2.4% |
-5,610 |
-2.6% |
|
Aberdeenshire |
188,920 |
202,600 |
7.2% |
226,940 |
236,260 |
4.1% |
47,340 |
25.1% |
|
Angus |
105,620 |
105,780 |
0.2% |
108,370 |
109,320 |
0.9% |
3,700 |
3.5% |
|
Argyll & Bute |
90,950 |
92,770 |
2.0% |
91,300 |
91,390 |
0.1% |
440 |
0.5% |
|
Clackmannanshire |
48,220 |
47,830 |
-0.8% |
48,070 |
48,900 |
1.7% |
680 |
1.4% |
|
Dumfries & Galloway |
145,500 |
145,170 |
-0.2% |
147,780 |
148,030 |
0.2% |
2,530 |
1.7% |
|
Dundee City |
169,580 |
160,180 |
-5.5% |
145,460 |
142,170 |
-2.3% |
-27,410 |
-16.2% |
|
East Ayrshire |
127,360 |
124,810 |
-2.0% |
120,310 |
119,290 |
-0.8% |
-8,070 |
-6.3% |
|
East Dunbartonshire |
109,680 |
111,000 |
1.2% |
108,250 |
105,460 |
-2.6% |
-4,220 |
-3.8% |
|
East Lothian |
80,720 |
81,540 |
1.0% |
90,180 |
92,830 |
2.9% |
12,110 |
15.0% |
|
East Renfrewshire |
80,240 |
81,660 |
1.8% |
89,410 |
89,290 |
-0.1% |
9,050 |
11.3% |
|
Edinburgh, City of |
445,990 |
439,010 |
-1.6% |
449,020 |
463,510 |
3.2% |
17,520 |
3.9% |
|
Eilean Siar |
31,550 |
30,970 |
-1.8% |
26,450 |
26,350 |
-0.4% |
-5,200 |
-16.5% |
|
Falkirk |
145,150 |
142,900 |
-1.6% |
145,270 |
149,680 |
3.0% |
4,530 |
3.1% |
|
Fife |
341,590 |
345,490 |
1.1% |
349,770 |
358,930 |
2.6% |
17,340 |
5.1% |
|
Glasgow City |
712,370 |
668,750 |
-6.1% |
578,710 |
580,690 |
0.3% |
-131,680 |
-18.5% |
|
Highland |
194,900 |
198,850 |
2.0% |
208,920 |
215,310 |
3.1% |
20,410 |
10.5% |
|
Inverclyde |
101,180 |
96,550 |
-4.6% |
84,150 |
81,540 |
-3.1% |
-19,640 |
-19.4% |
|
Midlothian |
83,580 |
80,380 |
-3.8% |
80,950 |
79,290 |
-2.1% |
-4,290 |
-5.1% |
|
Moray |
83,480 |
84,020 |
0.6% |
87,000 |
86,750 |
-0.3% |
3,270 |
3.9% |
|
North Ayrshire |
137,300 |
137,610 |
0.2% |
135,820 |
135,490 |
-0.2% |
-1,810 |
-1.3% |
|
North Lanarkshire |
341,690 |
333,330 |
-2.4% |
321,180 |
323,780 |
0.8% |
-17,910 |
-5.2% |
|
Orkney Islands |
19,180 |
19,080 |
-0.5% |
19,220 |
19,770 |
2.9% |
590 |
3.1% |
|
Perth & Kinross |
121,860 |
123,960 |
1.7% |
134,950 |
140,190 |
3.9% |
18,330 |
15.0% |
|
Renfrewshire |
185,080 |
179,290 |
-3.1% |
172,850 |
169,590 |
-1.9% |
-15,490 |
-8.4% |
|
Scottish Borders |
101,260 |
101,580 |
0.3% |
106,950 |
110,240 |
3.1% |
8,980 |
8.9% |
|
Shetland Islands |
26,350 |
22,400 |
-15.0% |
21,960 |
21,880 |
-0.4% |
-4,470 |
-17.0% |
|
South Ayrshire |
113,190 |
113,000 |
-0.2% |
112,160 |
111,670 |
-0.4% |
-1,520 |
-1.3% |
|
South Lanarkshire |
309,960 |
303,370 |
-2.1% |
302,340 |
307,670 |
1.8% |
-2,290 |
-0.7% |
|
Stirling |
80,260 |
81,200 |
1.2% |
86,200 |
87,810 |
1.9% |
7,550 |
9.4% |
|
West Dunbartonshire |
105,800 |
100,180 |
-5.3% |
93,320 |
91,240 |
-2.2% |
-14,560 |
-13.8% |
|
West Lothian |
139,200 |
139,420 |
0.2% |
159,030 |
165,700 |
4.2% |
26,500 |
19.0% |
Components of population change
Tables 2.2 and 2.3 explore how, in simple arithmetical terms, these changes were coming about both at the start and at the end of the period under review. For Scotland as a whole in the early 1980s, a small excess of births over deaths was much more than offset by emigration at an average rate of 3 per 1,000 population, resulting in a 1.3 per cent fall in population between 1981 and 1986. In contrast, by the early 21st century, much lower birth rates had outstripped the reduction in death rates, producing significant negative natural change, but this was more than offset by immigration at a rate almost as high as the emigration rate of 20 years earlier, resulting in population growth of one per cent between 2001 and 2006.
At Council area level however, the pattern has been much more mixed. In the early 1980s, 18 Council areas had positive natural increase and especially so in some of the suburbs and feeder areas of the cities, parts of West Central Scotland and also in the Shetland Islands and Highland where oil had stimulated population inflow among younger adults in earlier periods. In the early 1980s, most other rural areas and all city Council areas already showed natural decrease (more deaths than births).
Between 2001 and 2006, by contrast, 24 authorities had negative natural change with only a few suburban/feeder areas (noticeably West Lothian) plus Shetland showing significant positive trends.
However, in both time periods, it was net migration, from inside and outside Scotland, which in almost all areas produced the largest source of variation in population change. In the early 1980s, there was out-migration from 18 of the modern Council areas, particularly strong from the Shetland Islands, Dundee City, Midlothian, Glasgow City and West Dunbartonshire. By contrast, in the early 2000s, net out-migration was nowhere nearly as marked as 20 years earlier and only 9 authorities were experiencing this effect.
In-migration made little impact in the early 1980s, except in Aberdeenshire and Perth and Kinross. But between 2001 and 2006, annual inflows of more than 5 per 1,000 population were occurring in Aberdeenshire, East Lothian, City of Edinburgh, Falkirk, Highland, Orkney Islands, Perth and Kinross and Scottish Borders. The number of predominantly rural areas experiencing inflow was particularly notable in this period.
Table 2.2 Components of population change by Council area, 1981-1986
|
Estimated |
Average |
Average Yearly |
Average Natural |
Average Yearly |
Average Total |
Estimated |
Population |
Percentage |
|
|---|---|---|---|---|---|---|---|---|---|
|
SCOTLAND |
5,180,200 |
12.7 |
12.4 |
0.4 |
-3.0 |
-2.6 |
5,111,760 |
-68,440 |
-1.3% |
|
Council areas |
|||||||||
|
Aberdeen City |
212,490 |
11.8 |
12.4 |
-0.6 |
4.9 |
4.3 |
217,080 |
4,590 |
2.2% |
|
Aberdeenshire |
188,920 |
14.9 |
11.0 |
3.9 |
10.6 |
14.5 |
202,600 |
13,680 |
7.2% |
|
Angus |
105,620 |
12.3 |
12.4 |
-0.1 |
0.4 |
0.3 |
105,780 |
160 |
0.2% |
|
Argyll & Bute |
90,950 |
13.4 |
14.0 |
-0.6 |
4.6 |
4.0 |
92,770 |
1,820 |
2.0% |
|
Clackmannanshire |
48,220 |
13.1 |
10.9 |
2.2 |
-3.8 |
-1.6 |
47,830 |
-390 |
-0.8% |
|
Dumfries & Galloway |
145,500 |
11.9 |
13.2 |
-1.3 |
0.9 |
-0.5 |
145,170 |
-330 |
-0.2% |
|
Dundee City |
169,580 |
12.4 |
13.2 |
-0.8 |
-10.2 |
-11.1 |
160,180 |
-9,400 |
-5.5% |
|
East Ayrshire |
127,360 |
13.2 |
12.4 |
0.8 |
-4.8 |
-4.0 |
124,810 |
-2,550 |
-2.0% |
|
East Dunbartonshire |
109,680 |
12.9 |
9.0 |
3.9 |
-1.5 |
2.4 |
111,000 |
1,320 |
1.2% |
|
East Lothian |
80,720 |
11.4 |
12.5 |
-1.0 |
3.1 |
2.0 |
81,540 |
820 |
1.0% |
|
East Renfrewshire |
80,240 |
12.7 |
10.3 |
2.5 |
1.1 |
3.5 |
81,660 |
1,420 |
1.8% |
|
Edinburgh, City of |
445,990 |
11.3 |
13.1 |
-1.7 |
-1.4 |
-3.1 |
439,010 |
-6,980 |
-1.6% |
|
Eilean Siar |
31,550 |
11.6 |
15.4 |
-3.7 |
0.1 |
-3.7 |
30,970 |
-580 |
-1.8% |
|
Falkirk |
145,150 |
12.5 |
11.7 |
0.8 |
-3.9 |
-3.1 |
142,900 |
-2,250 |
-1.6% |
|
Fife |
341,590 |
13.1 |
12.0 |
1.2 |
1.1 |
2.3 |
345,490 |
3,900 |
1.1% |
|
Glasgow City |
712,370 |
12.8 |
14.6 |
-1.7 |
-10.5 |
-12.2 |
668,750 |
-43,620 |
-6.1% |
|
Highland |
194,900 |
13.5 |
12.5 |
1.0 |
3.0 |
4.1 |
198,850 |
3,950 |
2.0% |
|
Inverclyde |
101,180 |
12.8 |
12.6 |
0.3 |
-9.4 |
-9.2 |
96,550 |
-4,630 |
-4.6% |
|
Midlothian |
83,580 |
12.8 |
9.8 |
2.9 |
-10.6 |
-7.7 |
80,380 |
-3,200 |
-3.8% |
|
Moray |
83,480 |
13.7 |
11.8 |
1.9 |
-0.6 |
1.3 |
84,020 |
540 |
0.6% |
|
North Ayrshire |
137,300 |
13.7 |
12.4 |
1.3 |
-0.8 |
0.4 |
137,610 |
310 |
0.2% |
|
North Lanarkshire |
341,690 |
13.8 |
10.8 |
3.0 |
-7.9 |
-4.9 |
333,330 |
-8,360 |
-2.4% |
|
Orkney Islands |
19,180 |
12.3 |
12.8 |
-0.5 |
-0.6 |
-1.1 |
19,080 |
-100 |
-0.5% |
|
Perth & Kinross |
121,860 |
11.3 |
13.9 |
-2.6 |
6.1 |
3.4 |
123,960 |
2,100 |
1.7% |
|
Renfrewshire |
185,080 |
12.4 |
12.0 |
0.4 |
-6.7 |
-6.3 |
179,290 |
-5,790 |
-3.1% |
|
Scottish Borders |
101,260 |
11.1 |
14.7 |
-3.6 |
4.2 |
0.6 |
101,580 |
320 |
0.3% |
|
Shetland Islands |
26,350 |
12.3 |
9.7 |
2.6 |
-32.6 |
-30.0 |
22,400 |
-3,950 |
-15.0% |
|
South Ayrshire |
113,190 |
11.6 |
13.9 |
-2.3 |
2.0 |
-0.3 |
113,000 |
-190 |
-0.2% |
|
South Lanarkshire |
309,960 |
12.9 |
10.7 |
2.3 |
-6.5 |
-4.3 |
303,370 |
-6,590 |
-2.1% |
|
Stirling |
80,260 |
11.5 |
11.7 |
-0.2 |
2.6 |
2.3 |
81,200 |
940 |
1.2% |
|
West Dunbartonshire |
105,800 |
13.4 |
11.6 |
1.9 |
-12.5 |
-10.6 |
100,180 |
-5,620 |
-5.3% |
|
West Lothian |
139,200 |
14.8 |
9.2 |
5.6 |
-5.3 |
0.3 |
139,420 |
220 |
0.2% |
Table 2.3 Components of population change by Council area, 2001-2006
|
Estimated |
Average |
Average Yearly |
Average Natural |
Average Yearly |
Average Total |
Estimated |
Population |
Percentage |
|
|---|---|---|---|---|---|---|---|---|---|
|
SCOTLAND |
5,064,200 |
10.5 |
11.3 |
-0.8 |
2.8 |
2.1 |
5,116,900 |
52,700 |
1.0% |
|
Council areas |
|||||||||
|
Aberdeen City |
211,910 |
9.8 |
10.2 |
-0.4 |
-4.3 |
-4.7 |
206,880 |
-5,030 |
-2.4% |
|
Aberdeenshire |
226,940 |
10.5 |
9.3 |
1.2 |
7.0 |
8.2 |
236,260 |
9,320 |
4.1% |
|
Angus |
108,370 |
9.9 |
12.3 |
-2.4 |
4.1 |
1.8 |
109,320 |
950 |
0.9% |
|
Argyll & Bute |
91,300 |
8.4 |
12.5 |
-4.1 |
4.3 |
0.2 |
91,390 |
90 |
0.1% |
|
Clackmannanshire |
48,070 |
10.6 |
10.7 |
-0.2 |
3.6 |
3.5 |
48,900 |
830 |
1.7% |
|
Dumfries & Galloway |
147,780 |
9.3 |
12.6 |
-3.3 |
3.7 |
0.3 |
148,030 |
250 |
0.2% |
|
Dundee City |
145,460 |
10.5 |
12.3 |
-1.9 |
-2.6 |
-4.5 |
142,170 |
-3,290 |
-2.3% |
|
East Ayrshire |
120,310 |
10.2 |
12.0 |
-1.8 |
0.1 |
-1.7 |
119,290 |
-1,020 |
-0.8% |
|
East Dunbartonshire |
108,250 |
8.6 |
9.1 |
-0.5 |
-4.7 |
-5.2 |
105,460 |
-2,790 |
-2.6% |
|
East Lothian |
90,180 |
10.9 |
11.4 |
-0.5 |
6.4 |
5.9 |
92,830 |
2,650 |
2.9% |
|
East Renfrewshire |
89,410 |
10.1 |
9.7 |
0.5 |
-0.8 |
-0.3 |
89,290 |
-120 |
-0.1% |
|
Edinburgh, City of |
449,020 |
10.3 |
10.0 |
0.2 |
6.2 |
6.5 |
463,510 |
14,490 |
3.2% |
|
Eilean Siar |
26,450 |
9.0 |
14.6 |
-5.6 |
4.9 |
-0.8 |
26,350 |
-100 |
-0.4% |
|
Falkirk |
145,270 |
11.3 |
11.2 |
0.1 |
6.0 |
6.1 |
149,680 |
4,410 |
3.0% |
|
Fife |
349,770 |
10.6 |
11.0 |
-0.4 |
5.6 |
5.2 |
358,930 |
9,160 |
2.6% |
|
Glasgow City |
578,710 |
11.4 |
12.8 |
-1.4 |
2.0 |
0.7 |
580,690 |
1,980 |
0.3% |
|
Highland |
208,920 |
10.2 |
11.3 |
-1.1 |
7.2 |
6.1 |
215,310 |
6,390 |
3.1% |
|
Inverclyde |
84,150 |
10.0 |
12.9 |
-2.9 |
-3.3 |
-6.2 |
81,540 |
-2,610 |
-3.1% |
|
Midlothian |
80,950 |
10.7 |
10.4 |
0.3 |
-4.4 |
-4.1 |
79,290 |
-1,660 |
-2.1% |
|
Moray |
87,000 |
9.9 |
11.0 |
-1.1 |
0.5 |
-0.6 |
86,750 |
-250 |
-0.3% |
|
North Ayrshire |
135,820 |
10.3 |
11.9 |
-1.6 |
1.1 |
-0.5 |
135,490 |
-330 |
-0.2% |
|
North Lanarkshire |
321,180 |
11.9 |
10.8 |
1.1 |
0.5 |
1.6 |
323,780 |
2,600 |
0.8% |
|
Orkney Islands |
19,220 |
9.4 |
11.0 |
-1.7 |
7.4 |
5.7 |
19,770 |
550 |
2.9% |
|
Perth & Kinross |
134,950 |
9.5 |
11.9 |
-2.4 |
10.1 |
7.8 |
140,190 |
5,240 |
3.9% |
|
Renfrewshire |
172,850 |
10.6 |
11.8 |
-1.2 |
-2.6 |
-3.8 |
169,590 |
-3,260 |
-1.9% |
|
Scottish Borders |
106,950 |
9.9 |
12.6 |
-2.7 |
8.8 |
6.2 |
110,240 |
3,290 |
3.1% |
|
Shetland Islands |
21,960 |
10.8 |
9.4 |
1.4 |
-2.1 |
-0.7 |
21,880 |
-80 |
-0.4% |
|
South Ayrshire |
112,160 |
8.8 |
12.8 |
-4.0 |
3.1 |
-0.9 |
111,670 |
-490 |
-0.4% |
|
South Lanarkshire |
302,340 |
10.7 |
11.1 |
-0.4 |
3.9 |
3.5 |
307,670 |
5,330 |
1.8% |
|
Stirling |
86,200 |
10.1 |
10.4 |
-0.2 |
4.0 |
3.7 |
87,810 |
1,610 |
1.9% |
|
West Dunbartonshire |
93,320 |
10.5 |
12.3 |
-1.7 |
-2.7 |
-4.5 |
91,240 |
-2,080 |
-2.2% |
|
West Lothian |
159,030 |
12.9 |
9.2 |
3.7 |
4.7 |
8.4 |
165,700 |
6,670 |
4.2% |
Differences in age structure
Simply looking at average death and birth rates for people of all ages (as is done in Tables 2.2 and 2.3) can be very misleading and in particular can hinder understanding of some of the key dynamics underlying variation in population change by area. This is because significant variations in local death and birth rates can occur simply because of differing age structures of the population, and this can be particularly important if there are marked variations in proportions of age groups which are likely to have high mortality or higher fertility or potential fertility.
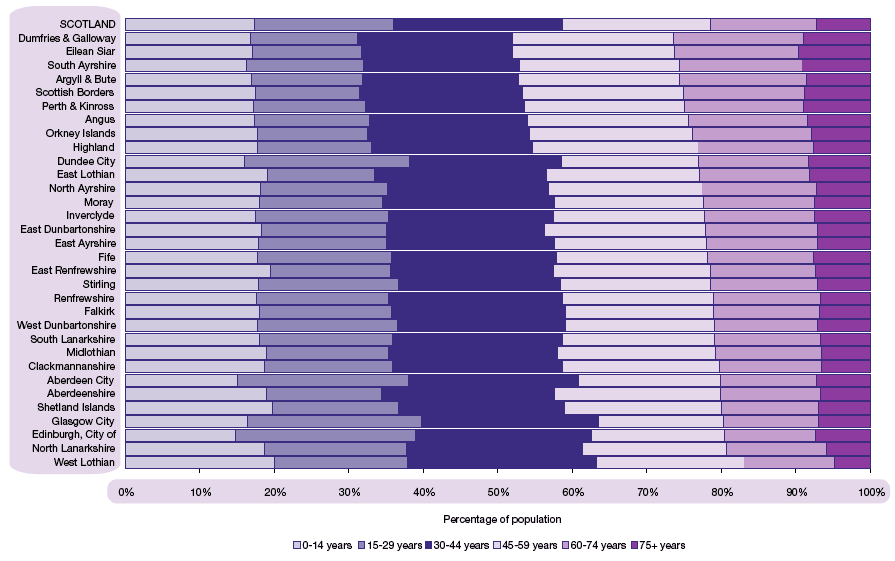
As Figure 2.1 shows, in the years 2001-05 there were significant differences between different areas of Scotland in these respects. Over a quarter of the population of Dumfries and Galloway, Eilean Siar, South Ayrshire, Argyll and Bute and Scottish Borders were aged 60 or over. At the other extreme, under 20 per cent of the population of West Lothian, North Lanarkshire, and City of Edinburgh were in this category. By contrast, just 35 per cent of the population of Dumfries and Galloway and Eilean Siar were aged 15-44, compared with 48 per cent in City of Edinburgh, 47 per cent in Glasgow City and 46 per cent in Aberdeen City; Dundee City, West Lothian and North Lanarkshire also had more than 42 per cent. The particular impact of higher education institutions, of which we shall see more implications later in this chapter, is also clear in Figure 2.1 in the high proportions in the 15-29 age group in the four big cities, peaking at over 24 per cent in City of Edinburgh compared with less than 19 per cent for Scotland as a whole.
Figure 2.1 Age structure of Scotland’s population for Council areas, 2001-05 (ordered by percentage aged 60 & over)

Though these differences may not seem large, they nevertheless do have a significant impact on the overall death and birth rates, as can be seen by comparing crude and standardised rates in Figures 2.2a and 2.2b for mortality and in Figures 2.9a and 2.9b (to be discussed later in this chapter) for fertility.
Age structure and mortality2
Figures 2.2a and 2.2b show the contrast between the crude death rates (CDR) and standardised death rates (SDR); the latter adjust the rates to what they would be if each Council area had had the same age structure as Scotland as a whole in the years 2001-05. In Figure 2.2a, as in Table 2.2, CDRs were especially high in Glasgow City and some surrounding areas. Rates were also high in rural areas, notably Eilean Siar (the highest at 14.6 per 1,000), Scottish Borders, Argyll and Bute and Dumfries and Galloway, all of which were areas with more than 23 per cent of their population aged 60 and over.
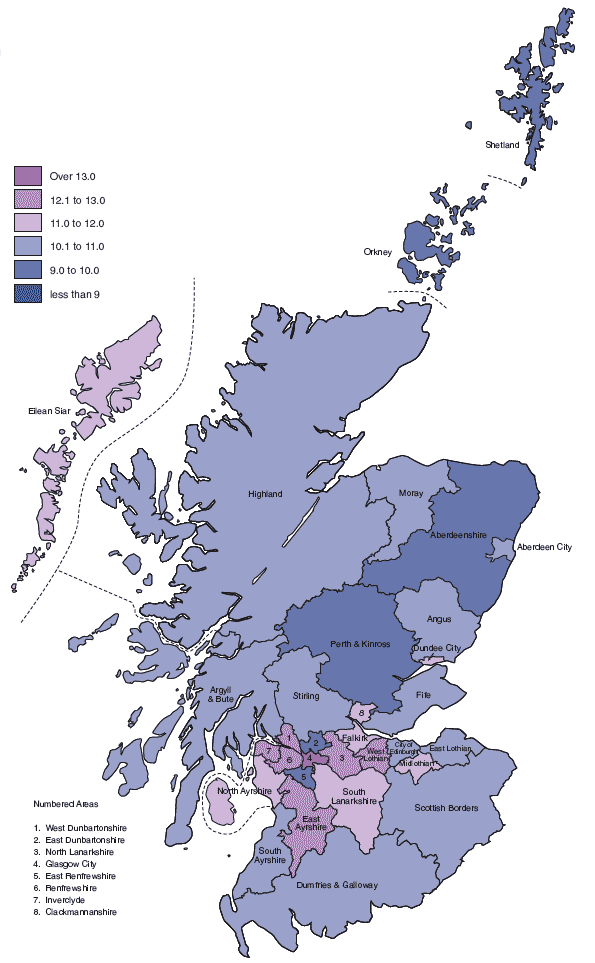
When mortality is standardised for age composition, as it is in Figure 2.2b, almost all the rural areas see a marked improvement in their relative standing. In rank order terms, Eilean Siar moved from 1st (worst) to 13th, South Ayrshire from third worst to 17th and Dumfries and Galloway from eighth worst to 24th. That is largely because these are the three areas with the highest proportion of people aged 60 and over – who inevitably have a higher death rate than the rest of the population.
Figure 2.2b also reveals the striking heartland of high mortality across the Central Belt. Indeed, Glasgow City’s situation in particular becomes much worse, with a crude death rate of 12.9 per 1,000 population and a standardised death rate of 14.0 per 1,000 population. Particularly notable also is the impact on West Lothian, with the lowest mortality before standardisation, becoming the sixth worst after it, as the beneficial effect of its youthful age structure is stripped away. Other points to note are the moderate SDRs in the three remaining city authority areas (especially City of Edinburgh and Aberdeen City), each with their surrounding feeder authorities with even lower mortality, and the generally modest SDRs across most of rural Scotland. Eilean Siar however, though markedly improved, is still notable as an area with mortality well above its most obvious rural comparators (the Highland, Shetland Islands and Orkney Islands local authority areas).
Figure 2.2a Crude death rates, per 1,000 population, by Council area, 2001-05
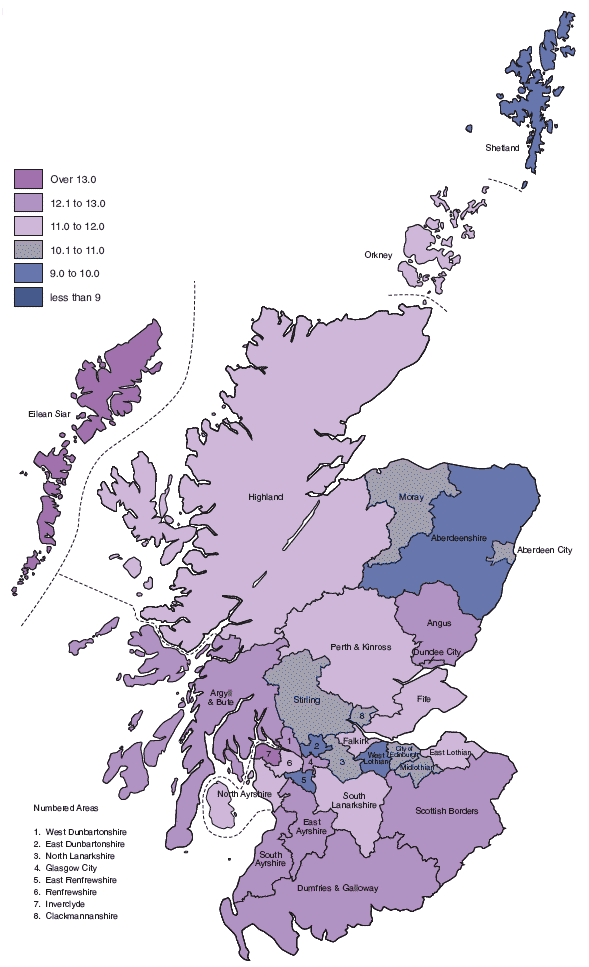
Figure 2.2b Standardised death rates, per 1,000 population, by Council area, 2001-05
Mortality at particular age groups and over time
The overall Scottish death rate fell between 1981-85 and 2001-05 from 12.4 to 11.3 per 1,000 population. After age-standardisation the relative falls per 1,000 population were particularly strong in many of the rural areas (-1.7 in South Ayrshire, -1.4 in Dumfries and Galloway and Highland, -1.3 in Argyll and Bute and Perth and Kinross, and -1.2 in Shetland Islands). There were also marked reductions in some of the principal suburban/feeder authorities (-1.3 in Aberdeenshire, -1.2 in East Renfrewshire) and in City of Edinburgh, Aberdeen City and Stirling, all of which fell by more than 1.0 per 1,000 population. There were also important reductions in some of the westerly Central Belt authorities, notably East Ayrshire and Renfrewshire, as well as Clackmannanshire further to the east. But, at the other extreme, Eilean Siar stands out as the only rural area even approaching a rise in SDR (where the age standardised rate actually rose by 1.0 per 1,000 population compared to the CDR), while Angus, Glasgow City, West Dunbartonshire and Inverclyde saw only slight improvement. West Lothian is also notable as an area where age-standardised mortality improved only slightly.
The improvement was particularly marked (and occurred across all local Council areas) among children under 15, among older adults, and to some extent even among those aged 65 and over. Encouragingly, among those aged 45 and over, many of the larger percentage falls occurred in the previously poorest performing areas in the Central Belt, in Dundee City, and even in Eilean Siar.
The principal exception to the overall pattern of improvement was among young adults and especially among young men (even though, as a proportion of all deaths, mortality at these ages remained relatively small). For Scotland as a whole, the death rate for women aged 15-34 (Figure 2.3) increased only marginally from 0.44 to 0.45 per 1,000 population between 1981-85 and 2001-05. But the age-specific mortality rate for women aged 15-34 rose in more than two-thirds of all Council areas, though usually by a small amount; only in Eilean Siar (plus 0.22 per 1,000 population), Shetland Islands, Perth and Kinross, Dundee City, Argyll and Bute, Stirling and Angus did it rise by more than 0.10 per 1,000 population.
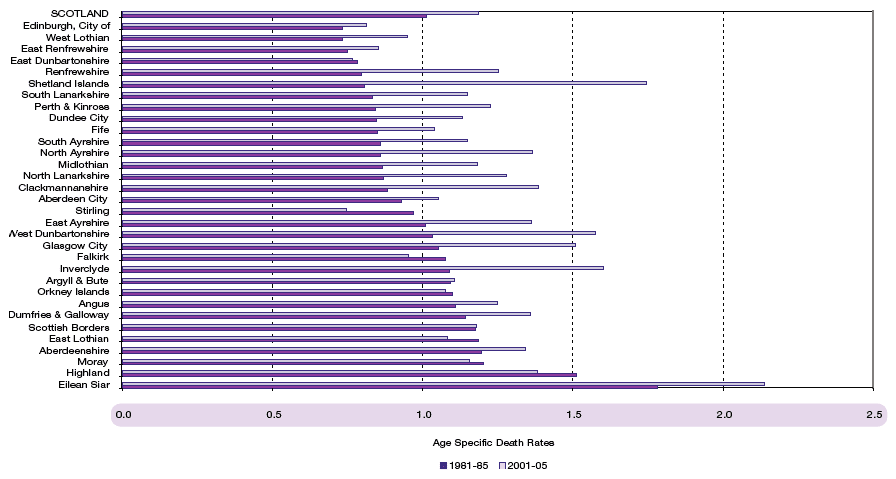
For males aged 15-34, by contrast (as Figure 2.4 shows), the death rate rose in Scotland from 1.01 to 1.19 per 1,000 population, increasing in 25 Council areas and by more than 0.20 per 1,000 population in 17 of them. What is particularly notable is the way that the rank order changed. Areas in the western Central Belt together with Dundee City saw particularly large rises, as did Eilean Siar and Shetland Islands. So, while, in 1981-85, none of the worst 10 Council areas was in the West Central Scotland area, in 2001-05 five were, with Glasgow City, West Dunbartonshire and Inverclyde immediately above Eilean Siar and Shetland Islands in the bottom five poorest places in the table. Glasgow City, North Ayrshire and West Dunbartonshire saw the largest increases after Shetland Islands, which dramatically moved from sixth best to second worst place. The Council areas with the best (lowest) age-specific death rates at age 15-34 for men in 2001-05 were Stirling, East Dunbartonshire, Edinburgh City and East Renfrewshire.
Figure 2.3 Age specific death rates by Council area for females aged 15-34, 1981-85 and 2001-05
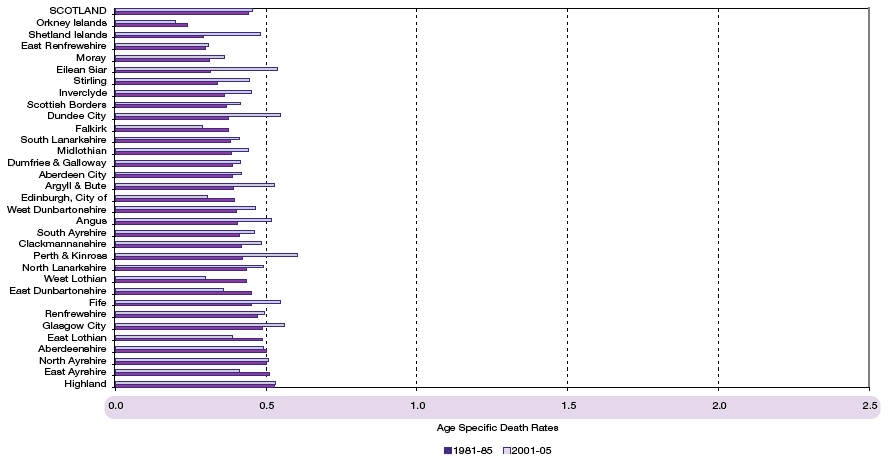
Figure 2.4 Age specific death rates by Council area for males aged 15-34, 1981-85 and 2001-05
Some significant causes of death
The MRC report (Leyland et al. 2007) shows that between 1980-82 and 2000-02 the rise in deaths among younger adult males, in a context where deaths from accidents have been falling quite sharply, is almost entirely attributable to major increases in mortality from intentional self-harm, and the mental and behavioural effects of drugs and alcohol; there is a smaller impact also, but especially among people over 40, of increased chronic liver disease.
By contrast, the fall in the death rate at the older age groups, where the mortality rate is even now much higher, was largely a result of reduced mortality from degenerative diseases, particularly diseases of the heart and circulatory systems and the commonest forms of cancer. Almost all of these showed significant falls at Scotland level, although these falls varied substantially across the country.
Causes of death for men
Taking first heart disease, there was a very marked fall in the crude death rate per 1,000 population for Scotland as a whole between 1981-85 and 2001-05, from 20.3 to 12.3 per 1,000 population. At both dates, there were marked differences across Scotland, especially once the effects of different age structures were removed. Figure 2.5 shows this by comparing the age-standardised rate for each Council area with the average for the country as a whole, which is represented by a score of 100. Thus, in 1981-85 the highest rates were in North Lanarkshire, East Ayrshire and Renfrewshire, all 18 per cent above the Scottish average. The next five places in rank order were all occupied by other West Central Scotland Council areas. At the other end, East Dunbartonshire and East Renfrewshire followed by Moray, Aberdeenshire, Scottish Borders and City of Edinburgh were all more than 10 per cent below the mean.
Figure 2.5 Standardised mortality ratios by Council area for heart disease, males, 1981-85 and 2001-05
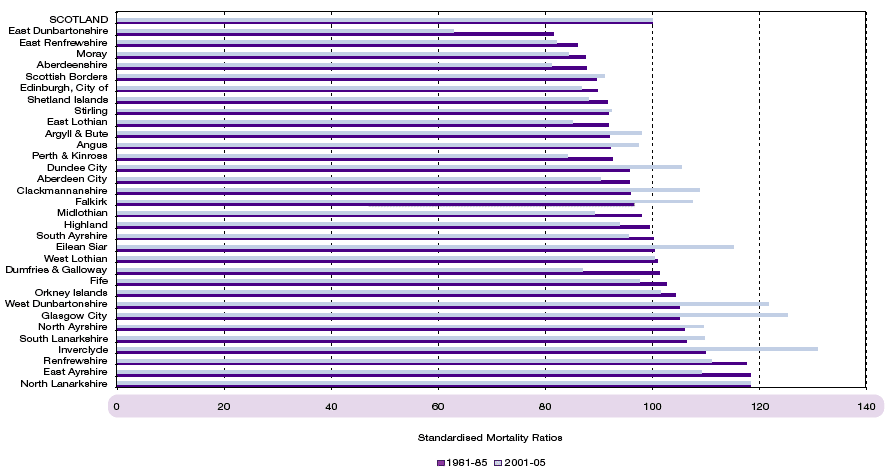
Over the next two decades, while all areas saw reductions in the death rate from heart disease, the relative position of three West Central Scotland authorities (Glasgow City, Inverclyde and West Dunbartonshire) became markedly worse, all now being more than 20 per cent above the average. Falkirk, Clackmannanshire and Dundee City went from being below the Scottish average in 1981-85 to above in 2001-05. The position of Eilean Siar became relatively much worse, rising in age-standardised terms to the fifth highest figure in Scotland. By contrast, the relative position of most of the best areas in 1981-85 saw further relative improvement, to a point where East Dunbartonshire improved to a figure of just 63 per cent of the Scottish average, and Aberdeenshire, East Renfrewshire, Moray and Perth and Kinross were all now more than 15 per cent below the mean.
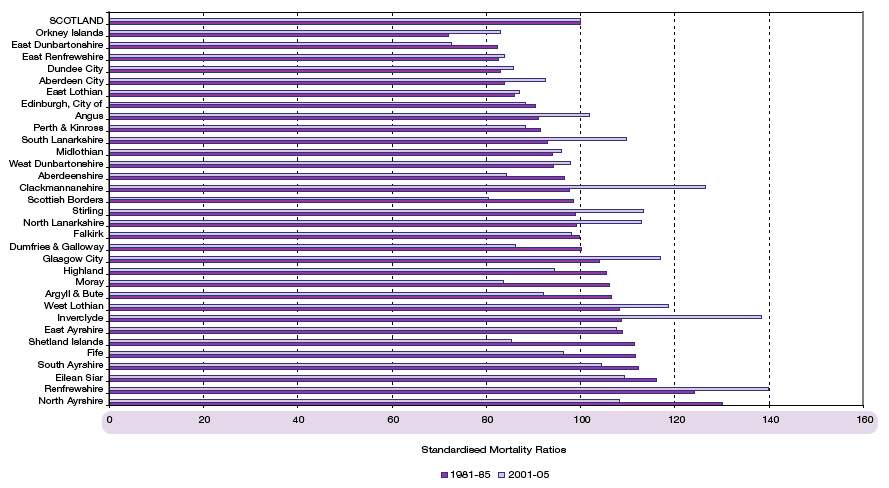
Broadly, similar trends can be observed also with respect to the two other major killers of men, though the starting positions were somewhat different. For cerebrovascular disease (stroke), mortality fell across Scotland from 6.6 to 4.8 per 1,000 population in spite of an ageing population. Figure 2.6 shows that, after the effect of age structure is removed, the three eastern city areas plus the more prosperous suburban authorities of East Dunbartonshire, East Renfrewshire and East Lothian broadly retained their strongly favourable positions relative to Scotland as a whole. By contrast, the relative positions of Inverclyde, Glasgow City, North and South Lanarkshire and Renfrewshire all deteriorated, and they joined North Ayrshire as six of the worst ten authorities in Scotland. Also showing marked relative deterioration and now joining the worst ten were three other Central Belt authorities with a significant history of heavy industry and mining, namely West Lothian, Stirling and Clackmannnanshire. As with other major killers of older men, and in marked contrast to the general picture for more rural authorities, Eilean Siar also remained in the top ten worst areas for this cause of death.
Figure 2.6 Standardised mortality ratios by Council area for cerebrovascular disease, males, 1981-85 and 2001-05
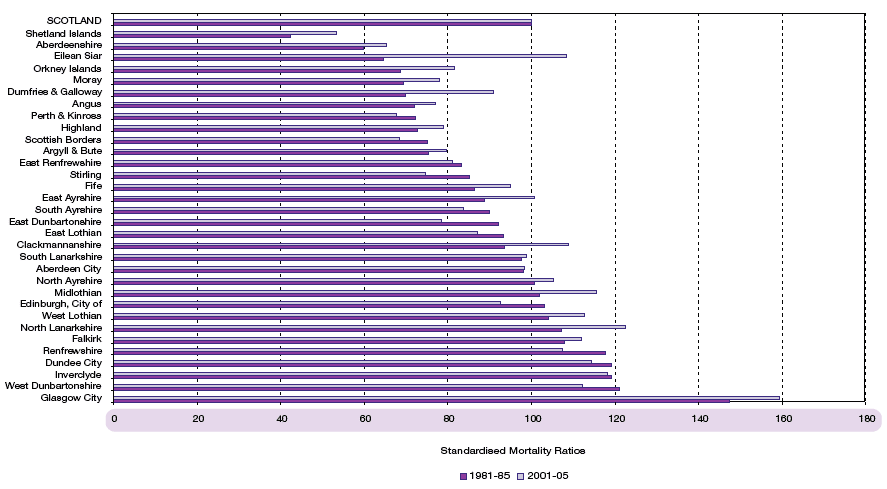
There was a fall in overall male lung cancer mortality in Scotland between 1981-85 and 2001-05 from 6.0 to 4.6 per 1,000 population. Figure 2.7 shows that, even after age standardisation, the most striking single feature is both the very high death rate and the very marked relative deterioration in Glasgow City’s position, rising to 59 per cent above the national average by 2001-05. Other areas more than 10 per cent above the mean in 2001-05 were North Lanarkshire, Inverclyde, Midlothian, Dundee City, West Lothian, Falkirk and West Dunbartonshire, with Clackmannanshire at 9 per cent above the mean. Eilean Siar again showed a marked relative deterioration, in this case from 35 per cent below to 8 per cent above the average for the country as a whole. Most of the other rural authorities, as well as the more prosperous suburban and feeder areas remained as areas of relatively low mortality from lung cancer.
Figure 2.7 Standardised mortality ratios by Council area for lung cancer, males, 1981-85 and 2001-05
Causes of death for women
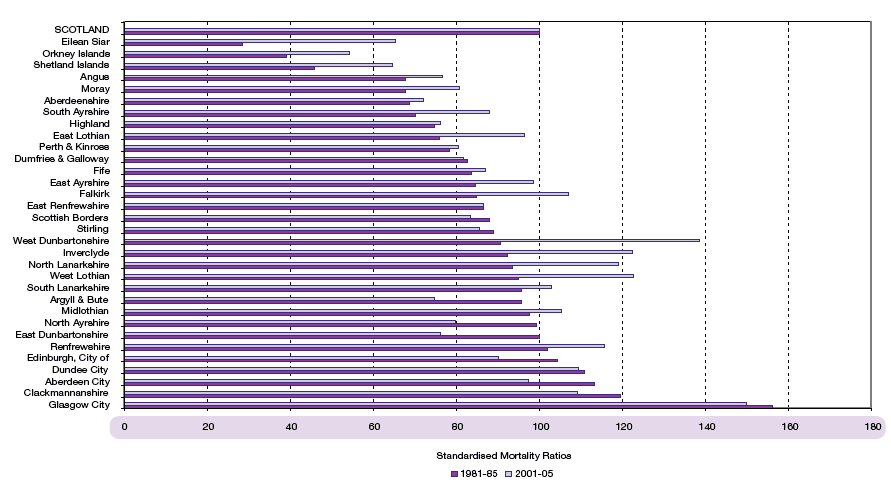
Finally, in Figure 2.8, we turn to female lung cancer where, in contrast to the situation for men, the death rate rose over the period from 2.3 to 3.3 per 1,000 population. In this context, while Glasgow City relatively improved a little, it was only from 56 per cent above the national average in 1981-85 to 50 per cent above in 2001-05 (the highest in both periods). However, the most notable feature is the marked worsening in rank order of West Lothian, North Lanarkshire, Inverclyde and West Dunbartonshire; in 1981-85 they ranked 12th to 15th worst and in 2001-05 they had risen to second to fifth worst. West Dunbartonshire moved from 9 per cent below to 39 per cent above the Scottish mean.
Figure 2.8 Standardised mortality ratios by Council area for lung cancer, females, 1981-85 and 2001-05
Fertility
Chapter 2 of the 2002 Annual Review contained extensive analysis of trends in fertility in Scotland, with limited reference to changes by Council area. Here we extend that analysis, using a different set of indicators and covering more years.
As Table 2.3 showed, for the years between 2001 and 2006, the birth rate for Scotland was 10.5 per 1,000 population, but with wide variation between different Council areas from a high of 12.9 in West Lothian to a low of 8.4 in Argyll and Bute. In general, rural areas showed particularly low crude birth rates (CBR). However, as with crude death rates, birth rates calculated across all age groups are highly influenced by population age structure, as a comparison of Figure 2.9a with Figure 2.9b clearly shows. Age standardisation produces a much better indicator of the actual fertility behaviour of men and women in a population. It shows that the highest underlying fertility is in fact in most rural areas and in the feeder authorities around the major cities. Fertility in the four city authorities themselves is, by contrast, low, especially in City of Edinburgh (8.6 per 1,000 population). In all these four cases, the large student component of their populations is an important, but certainly not the only, factor helping to keep their fertility low.
Figure 2.9a Crude birth rates, per 1,000 population, by Council area, 2001-05
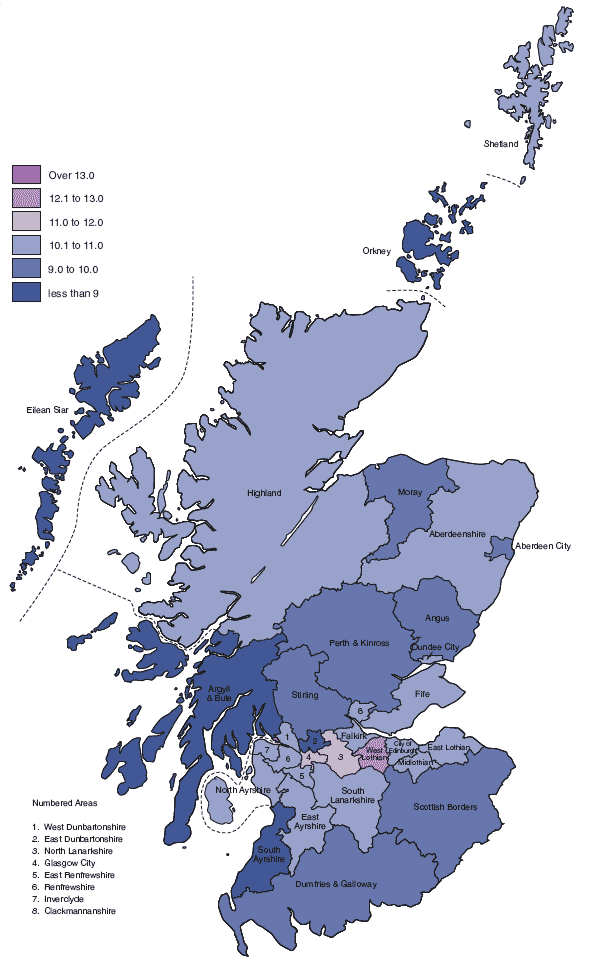
Figure 2.9b Standardised birth rates, per 1,000 population, by Council area, 2001-05
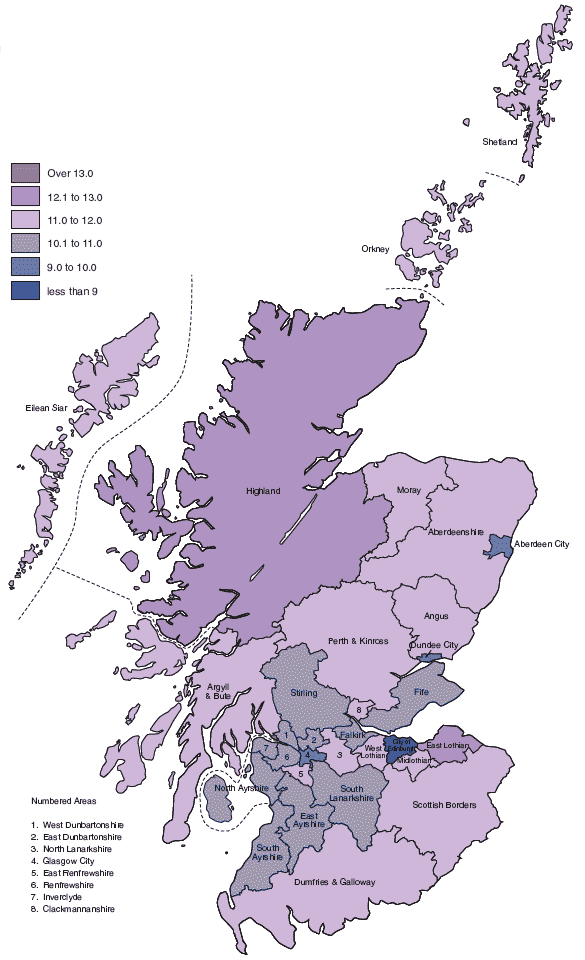
Table 2.4a and Table 2.4b show the age standardised birth rates (SBR) for Council areas for 1981-85 and for 2001-05. Nationally, the birth rate was 10.4 per 1,000 population in 2001-05 compared with 12.9 two decades earlier. In 1981-85 it was also the case that the standardised birth rate was markedly higher in the more rural Council areas, especially in the north and north-west, but many of the next highest levels were to be found in the older former staple industry areas of the Central Belt. City of Edinburgh and Aberdeen City had distinctively low rates (10.3 and 10.4 respectively) but Glasgow City was only slightly below the national average at 12.5.
Table 2.4a Range of ages of mothers at childbirth, 1981-85
|
Standardised Birth |
Mother’s age at childbirth, quantiles |
||||
|---|---|---|---|---|---|---|
|
1st Declie |
1st Quartile |
Median |
3rd Quartile |
9th Decile |
||
|
SCOTLAND |
12.9 |
19.0 |
21.6 |
25.0 |
28.7 |
32.4 |
|
Council areas |
||||||
|
Aberdeen City |
10.4 |
19.0 |
21.6 |
24.7 |
28.3 |
31.7 |
|
Aberdeenshire |
14.8 |
19.9 |
22.4 |
25.5 |
28.9 |
32.3 |
|
Angus |
14.1 |
19.5 |
21.9 |
25.0 |
28.5 |
32.2 |
|
Argyll & Bute |
15.2 |
19.6 |
22.1 |
25.4 |
29.3 |
33.2 |
|
Clackmannanshire |
13.8 |
18.7 |
21.2 |
24.5 |
28.3 |
31.8 |
|
Dumfries & Galloway |
13.3 |
19.1 |
21.6 |
24.8 |
28.5 |
32.2 |
|
Dundee City |
12.2 |
18.2 |
20.6 |
23.7 |
27.3 |
31.0 |
|
East Ayrshire |
13.7 |
18.7 |
21.3 |
24.6 |
28.3 |
32.2 |
|
East Dunbartonshire |
13.0 |
21.4 |
24.6 |
27.6 |
30.7 |
33.8 |
|
East Lothian |
12.2 |
19.7 |
22.3 |
25.4 |
28.9 |
32.3 |
|
East Renfrewshire |
13.5 |
21.2 |
24.4 |
27.5 |
30.7 |
33.7 |
|
Edinburgh, City of |
10.3 |
19.3 |
22.4 |
26.1 |
29.7 |
33.0 |
|
Eilean Siar |
15.7 |
19.4 |
22.5 |
26.6 |
31.0 |
35.1 |
|
Falkirk |
12.9 |
19.1 |
21.5 |
24.7 |
28.2 |
31.8 |
|
Fife |
13.5 |
18.9 |
21.3 |
24.5 |
28.0 |
31.7 |
|
Glasgow City |
12.5 |
18.2 |
20.6 |
23.9 |
27.9 |
31.8 |
|
Highland |
14.5 |
19.1 |
21.7 |
25.3 |
29.3 |
33.1 |
|
Inverclyde |
13.1 |
18.6 |
21.0 |
24.3 |
28.2 |
32.2 |
|
Midlothian |
12.7 |
19.6 |
22.2 |
25.3 |
28.8 |
32.2 |
|
Moray |
14.6 |
19.2 |
21.6 |
24.6 |
28.2 |
32.0 |
|
North Ayrshire |
14.2 |
18.6 |
21.2 |
24.5 |
28.3 |
32.1 |
|
North Lanarkshire |
13.7 |
19.0 |
21.5 |
24.8 |
28.5 |
32.4 |
|
Orkney Islands |
14.5 |
19.1 |
21.8 |
25.7 |
29.8 |
33.5 |
|
Perth & Kinross |
12.3 |
19.4 |
22.2 |
25.6 |
29.3 |
32.9 |
|
Renfrewshire |
12.7 |
18.9 |
21.6 |
25.3 |
29.0 |
32.6 |
|
Scottish Borders |
12.7 |
19.6 |
22.3 |
25.4 |
29.0 |
32.6 |
|
Shetland Islands |
14.1 |
19.2 |
21.8 |
25.3 |
29.1 |
33.3 |
|
South Ayrshire |
13.1 |
19.1 |
22.0 |
25.5 |
29.4 |
33.0 |
|
South Lanarkshire |
13.4 |
19.4 |
22.2 |
25.5 |
29.0 |
32.5 |
|
Stirling |
11.7 |
19.2 |
22.0 |
25.6 |
29.6 |
33.4 |
|
West Dunbartonshire |
13.4 |
18.9 |
21.5 |
24.9 |
28.5 |
32.2 |
|
West Lothian |
13.5 |
19.1 |
21.6 |
24.8 |
28.3 |
32.1 |
Table 2.4b Range of ages of mothers at childbirth, 2001-05
|
Standardised Birth |
Mother’s age at childbirth, quantiles |
||||
|---|---|---|---|---|---|---|
|
1st Declie |
1st Quartile |
Median |
3rd Quartile |
9th Decile |
||
|
SCOTLAND |
10.4 |
21.0 |
24.7 |
29.3 |
33.1 |
36.3 |
|
Council areas |
||||||
|
Aberdeen City |
9.1 |
19.7 |
23.8 |
28.9 |
32.7 |
35.8 |
|
Aberdeenshire |
11.7 |
21.7 |
25.6 |
29.5 |
33.0 |
36.2 |
|
Angus |
11.9 |
19.4 |
23.4 |
28.5 |
32.3 |
35.6 |
|
Argyll & Bute |
11.2 |
20.3 |
24.7 |
29.4 |
33.4 |
36.7 |
|
Clackmannanshire |
11.2 |
19.0 |
22.5 |
27.6 |
32.1 |
35.6 |
|
Dumfries & Galloway |
11.7 |
19.1 |
22.7 |
28.0 |
32.3 |
35.7 |
|
Dundee City |
9.8 |
18.4 |
21.4 |
26.5 |
31.3 |
35.2 |
|
East Ayrshire |
10.9 |
18.9 |
22.7 |
27.9 |
32.0 |
35.6 |
|
East Dunbartonshire |
10.4 |
22.3 |
27.4 |
31.3 |
34.6 |
37.3 |
|
East Lothian |
12.1 |
20.4 |
25.4 |
30.0 |
33.7 |
36.7 |
|
East Renfrewshire |
11.9 |
23.4 |
27.8 |
31.4 |
34.6 |
37.3 |
|
Edinburgh, City of |
8.6 |
20.3 |
25.3 |
30.3 |
33.9 |
37.0 |
|
Eilean Siar |
11.4 |
21.5 |
26.1 |
30.3 |
34.0 |
37.1 |
|
Falkirk |
10.9 |
19.7 |
23.8 |
28.5 |
32.4 |
35.5 |
|
Fife |
10.8 |
19.3 |
22.9 |
28.0 |
32.2 |
35.5 |
|
Glasgow City |
9.5 |
19.1 |
22.7 |
28.0 |
32.6 |
36.0 |
|
Highland |
12.1 |
19.7 |
23.7 |
28.8 |
33.1 |
36.6 |
|
Inverclyde |
10.9 |
18.8 |
22.2 |
28.0 |
32.4 |
35.7 |
|
Midlothian |
11.8 |
19.4 |
23.8 |
28.9 |
32.9 |
35.8 |
|
Moray |
11.6 |
19.8 |
23.8 |
28.2 |
32.1 |
35.6 |
|
North Ayrshire |
10.9 |
19.0 |
22.2 |
27.3 |
31.8 |
35.4 |
|
North Lanarkshire |
11.3 |
19.3 |
23.0 |
28.2 |
32.2 |
35.3 |
|
Orkney Islands |
11.1 |
19.8 |
24.2 |
28.9 |
33.2 |
37.2 |
|
Perth & Kinross |
11.5 |
20.5 |
25.2 |
29.8 |
33.4 |
36.4 |
|
Renfrewshire |
10.8 |
19.5 |
23.7 |
29.1 |
33.0 |
36.0 |
|
Scottish Borders |
11.7 |
20.5 |
25.1 |
30.0 |
33.6 |
36.76 |
|
Shetland Islands |
12.0 |
20.4 |
24.3 |
28.9 |
32.9 |
36.9 |
|
South Ayrshire |
10.5 |
19.3 |
23.7 |
28.9 |
32.9 |
36.4 |
|
South Lanarkshire |
10.8 |
20.1 |
24.3 |
29.1 |
32.9 |
36.0 |
|
Stirling |
10.4 |
20.6 |
25.4 |
30.4 |
33.8 |
36.9 |
|
West Dunbartonshire |
10.5 |
18.8 |
22.4 |
27.8 |
32.4 |
35.8 |
|
West Lothian |
11.9 |
19.6 |
23.7 |
28.6 |
32.4 |
35.5 |
By 2001-05, the relative positions of the SBRs had changed markedly, with many of the rural areas falling back, and many of the commuter belt ‘feeder’ areas rising up the rank order, as people increasingly chose these areas to start families in. Much of West Central Scotland (including Glasgow City itself) had seen a fall in relative position, with the exception of East Renfrewshire, which showed one of the highest SBRs in 2001-05.
Patterns of fertility by age
Alongside these changes in overall fertility, the period covered by this review also saw major changes in the ages at which women had children. These are also shown for Scotland for 1981-85 and 2001-05 in Tables 2.4a & b. Over this period, the median age at childbearing3 for Scotland as a whole rose from 25 to 29 and the upper quartile4 from 28 to 33. In fact, looked at in age-specific fertility terms, by 2001-05, the age group at which women were most likely to have children moved from 25-29 to 30-34; as recently as the early 1990s, more women were having children at 30-34 than at 20-24.
These changes occurred to some extent in all Council areas, and the rank order of ages at childbearing changed only a little, but the most marked effect revealed by Tables 2.4a & b is a greater differentiation and extension in the most frequent ages of childbearing between areas, especially at the younger age groups.
In 1981-85, 28 of the 32 areas had a first quartile age of childbearing5 of 21 or 22; in Glasgow City and Dundee City the first quartile was 20, in East Dunbartonshire and East Renfrewshire it was 24. By 2001-05, only seven authorities still had a first quartile age of childbirth below the age of 23 (Dundee City was still the lowest, now at 21). Fourteen areas had a first quartile of 23 or 24, but more than three-quarters of mothers gave birth after their 25th birthday in nine authorities; in East Dunbartonshire and East Renfrewshire mothers were 27 before a quarter of them had given birth in a year.
This markedly increased differentiation of ages is equally apparent at the median age of childbearing; in 1981-85, the medians for local authorities ranged from 24 to 28, with the overall Scottish median at 25. By 2001-05, they ranged from 27 to 31, with the overall Scottish median at 29. In general, older ages at childbearing were most likely to be found in more middle-class feeder areas of the cities and in most of the more rural Council areas.
Births inside and outside marriage
In 1981-85, 15 per cent of all births in Scotland were to unmarried mothers, with Glasgow City and Dundee City having the highest proportions at 25 per cent. By 2001-05, the Scotland level figure had tripled to 45 per cent, with the list still headed by Dundee City (at 60 per cent), but followed now by eight Western Central Belt authorities, all but two of which had rates in excess of 50 per cent. Increases occurred in every local Council area, and these increases were more than 30 percentage points in over half of all Council areas. The increase was marked even in some of the more middle class and highlands and island Council areas where rates had been particularly low in the past.
As elsewhere in North-Western Europe, much of this increase resulted from a major rise in childbearing in cohabitations outside marriage. Figure 2.10 shows the percentage of all births to mothers not married to the father of the child in 2001-05, differentiating between cases where the child was registered in the names of both parents and where they recorded themselves as living at the same address, cases registered in the name of both parents but with different addresses, and cases where only the mother’s name was recorded at the time of registration. Unfortunately, information at this level of detail is not available for 1981-85.
Figure 2.10 Percentage of all live births to unmarried parents by Council area, 2001-05
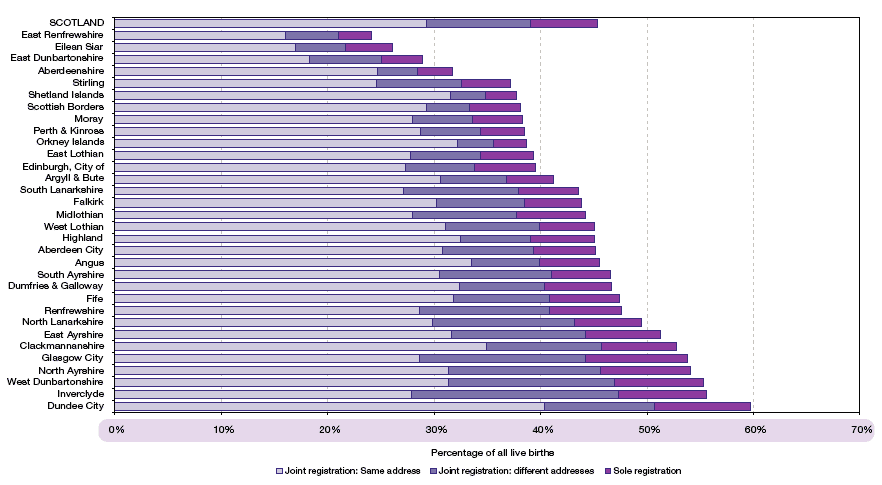
What Figure 2.10 shows, first, is that only a relatively small proportion of births in 2001-05 were solely registered to unmarried mothers in any area of Scotland. The highest as a percentage of all births was in Glasgow City (10 per cent), followed by Dundee City (9 per cent) and North Ayrshire, West Dunbartonshire and Inverclyde (8 per cent). At the other extreme, Dundee City also stood out as having by far the highest proportion of births registered in the names of both parents and recording the same address – indeed, at over 40 per cent, this was actually marginally higher than the proportion of all births registered by married parents. Relatively high levels (above 30 per cent) of births in what are normally assumed to be some kind of cohabitation were otherwise widely found across a range of Scottish areas, rural, suburban and older industrial heartlands. By contrast, the lowest rates were in the three areas which had the highest propensity for children to be born to mothers at the oldest age groups – East Renfrewshire, Eilean Siar and East Dunbartonshire.
Finally it is worth noting that there were six Council areas where more than one birth in eight was registered in the name of both parents but they were recorded as living at different addresses. All six were in the more deprived areas of West Central Scotland (as were two of the next three), and probably reflect younger people’s difficulties in establishing joint households and long-term stable relationships in these areas.
Age-standardised rates combined, 1981-85
Figure 2.11 combines age-standardised birth rates on the vertical axis and death rates on the horizontal axis for 1981-85. The diagonal line represents all points where the values of the two variables are equal. If the graph showed crude rates, this would represent all points where natural change was zero, with deaths equaling births. The further that points are located at right angles above and left of the line, the higher the rate of natural increase, while the further they are located at right angles below and right of the line, the higher the rate of natural decrease.
But this graph plots age-standardised rates, not crude rates. It thus eliminates the impact of different age structures and shows where areas would be located if their age-specific fertility and mortality were unchanged but if they had age structures identical to that of Scotland as a whole. One way of interpreting them is that they show the relative demographic performance of different local authorities; another is that they show what the impact is of the experience of births and deaths on individuals living in the area. For Scotland, of course, the crude rate is the same as the standardised rate in any year (CBR = SBR and CDR = SDR).
Figure 2.11 shows that, in the early 1980s, Scotland as a whole was showing very modest natural increase with a CBR of 12.9 and a CDR of 12.4. Moreover, measured in age-standardised terms, only six areas had SBR below SDR. Four of these were the city authority areas, but for somewhat different reasons, with City of Edinburgh and Aberdeen City showing extremely low birth rates and death rates, while Glasgow City had a higher birth rate but an extremely high death rate, and Dundee City fell somewhere between the two positions. Also below the line were Renfrewshire and Inverclyde, with roughly average birth rates but very high death rates. North Lanarkshire, North Ayrshire and West Dunbartonshire were only saved from negative underlying change because their high death rates were combined with well above average birth rates.
At the other extreme, a significant cluster of areas showed extremely strong underlying growth because their high or very high birth rates were combined with low or very low death rates. Highest of all (and completely the opposite from what would be concluded on the basis of crude rates) was Eilean Siar with an SBR of 15.7 and an SDR of 11.5 (compared to its CBR of 11.9 and CDR of 15.1). It was joined in strongly positive underlying performance by all the remaining island and highland authorities and, at a slightly lower level, by the remaining more rural Council areas and by the more prosperous suburban and feeder areas of the four largest cities.
Figure 2.11 Standardised birth rates and death rates, 1981-85
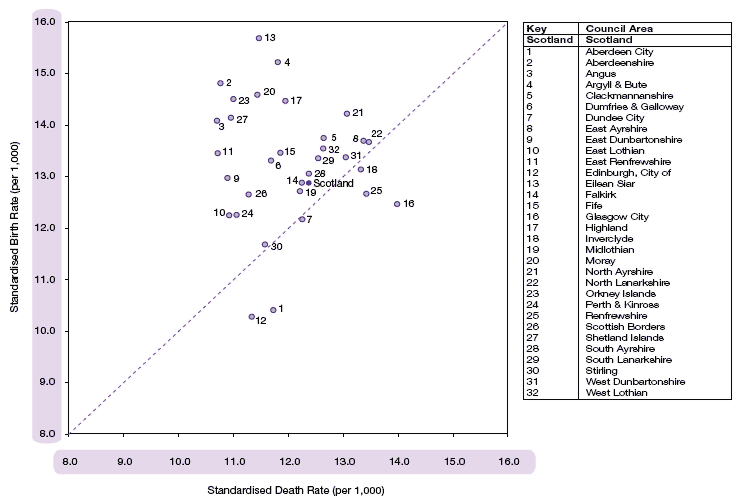
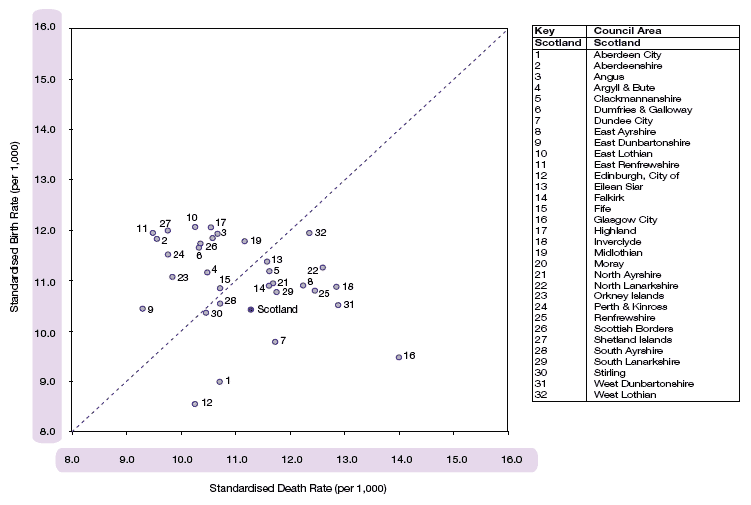
Figure 2.12 Standardised birth rates and death rates, 2001-05
Age-standardised rates combined, 2001-05
Figure 2.12 shows that, by the early 21st century, the overall picture had markedly changed, although the principal sources of variation between authorities remained largely the same. Seventeen authorities now lay below the line, compared with six 20 years earlier. Towards the bottom right, and for some in significant negative territory, lay most of the former staple and extractive industry authorities of West Central Scotland with, at the extreme, Glasgow City showing a difference between SBR and SDR of 4.5 per 1,000, as a result of an almost unchanged death rate since 1981-85, but a dramatic reduction in fertility. Towards the bottom left, City of Edinburgh, Aberdeen City and Dundee City also show strongly negative positions, but, particularly for the first two, this is principally due to their extremely low fertility – indeed, City of Edinburgh combined significantly the lowest SBR (8.6) with the seventh lowest SDR (10.3).
Above the line are to be found broadly the same groups of areas as 20 years earlier, although most of the rural areas now had only modest underlying growth and most were outperformed by the feeder and suburban authorities. The one exception is Eilean Siar, where fertility had fallen much in line with other rural areas, but mortality remained stubbornly almost unchanged, falling by only 0.5 per 1,000 population after the effect of age structure is removed. This compares with a reduction of 1.1 per 1,000 population for Scotland as a whole.
Net and gross migration
The final strand of our overview of internal variation in Scotland’s demography and how it has changed over time, looks at migration. This is the most difficult area to measure in detail because it cannot rely on civil registration. The most robust data are only available every ten years from the Census, and these data for the years 2000-2001 were summarised in some detail in the 2003 Annual Review. For periods other than Census years, the Reviews use data on registration by individuals with general medical practitioners. It is these figures which are used here, but they are not available for modern Council areas for the 1980s, so this section is confined to the 2002-06 period.
In these years the numbers of migrants into Scotland (from the rest of the UK and overseas) exceeded the number of out-migrants – in contrast to the 1990s, when net migration was positive in only 3 years. But, as Table 2.3 showed, net levels varied widely between the extremes of Perth and Kinross and Scottish Borders at an average for the years 2001 to 2006 of plus 10.1 and plus 8.8 per 1,000 population as opposed to East Dunbartonshire at minus 4.7, Midlothian at minus 4.4 and Aberdeen City at minus 4.3. In general terms, high rates of net in-migration were found in many of the more rural authorities as well as some, but not all, of the feeder and suburban areas. Net out-migration was particularly concentrated in the West Central Scotland area, where, as was shown earlier in this chapter, underlying population change was also significantly negative due to high levels of mortality.
Net levels, however, conceal very substantial levels of gross movements both into and out of areas. Within Scotland as a whole, as Figure 1.25 shows, in and out movements between Scotland and the rest of the UK are quite significant in the late teens and early twenties as young adults leave home to go into higher education and then into employment. At steadily falling levels, movements thereafter continue for the rest of people’s lives.
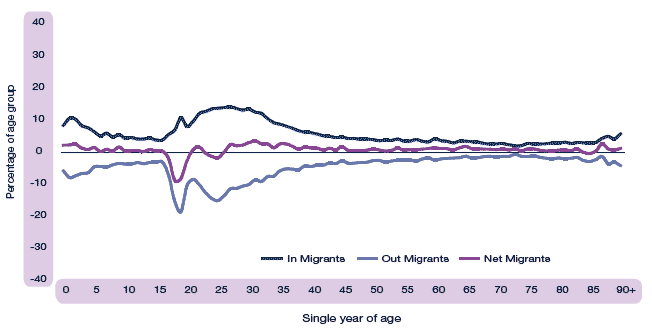
This pattern shows marked variation between different kinds of areas – data on the full set of Council areas can be found on our website. Examples of the most common types of movement are shown in Figures 2.13a to 2.13d. Figure 2.13a (Edinburgh City) shows the pattern observable to a considerable degree in all of the five authorities with high proportions of their populations as students and also with in-comers attracted by significant knowledge-based older adult employment. The in and out student movement is very clear, with very considerable continuing movement in both directions among post-student aged adults of all ages. The other side of many of these processes is found in most of the suburban and feeder authorities, illustrated in Figure 2.13b (East Lothian). Significant gross and modest net out movement in late teens is followed by continuing adult levels of in and out migration, but, as couples with children move into family homes and away from cities, the net movement is positive at almost all later adult ages including in older age groups as elderly relatives join families from elsewhere.
Figure 2.13a All migrants as a percentage of age group population by age group, City of Edinburgh, 2002-06
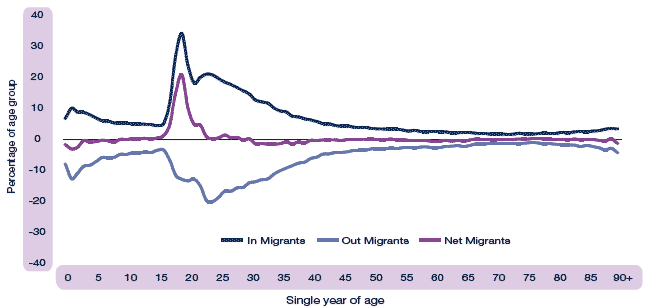
Figure 2.13b All migrants as a percentage of age group population by age group, East Lothian, 2002-06
A third pattern is apparent in many of the rural areas of the country, illustrated in Figure 2.13c by the Orkney Islands, with a marked outflow among those leaving for higher education elsewhere but then followed by a modest in- and out-movement later in life, producing consistent and significant net inflows at almost all ages after 20.
Figure 2.13c All migrants as a percentage of age group population by age group, Orkney Islands, 2002-06
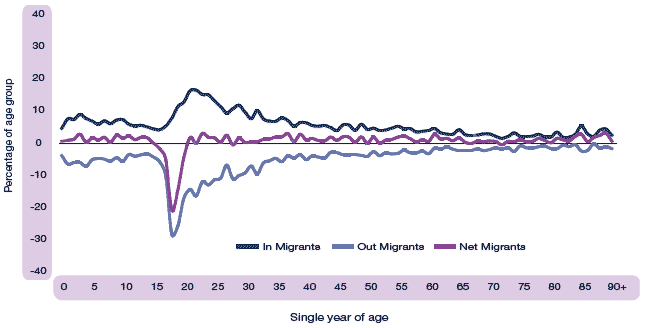
Figure 2.13d All migrants as a percentage of age group population by age group, North Lanarkshire, 2002-06
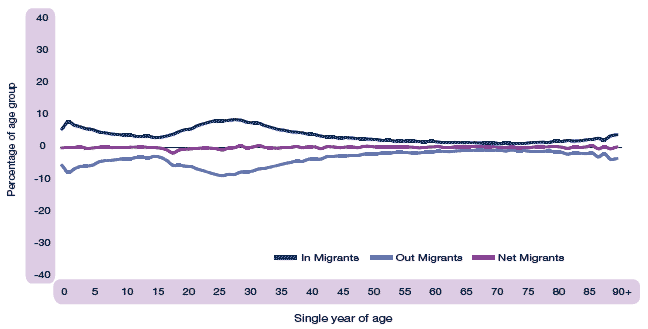
Finally, there is a series of authorities in the Western Central Belt, illustrated in Figure 2.13d by North Lanarkshire, the same ones as those with strongly negative age standardised population change, which show very low out-movement in late teenage years, as few leave to go into higher education away from home, and only extremely modest in and out movement after age 20.
Migration from outside Scotland
For more detail on migration from outside Scotland, much useful material can be obtained from the 2001 Census, in the occasional paper "Scotland’s Census 2001 : Statistics on Migration" (http://www.nrscotland.gov.uk/statistics-and-data/statistics/statistics-by-theme/migration/scotlands-census-2001-statistics-on-migration). In addition, for more recent periods, information on birthplaces of mothers of children being born in Scotland (Figure 2.14) provides one particularly interesting insight into the origins of those who are building new families in Scotland.
Overall, in the years 2001-05, 18.5 per cent of babies were born to mothers who had not themselves been born in Scotland. But, as Figure 2.14 shows, there are marked variations across the country from 32 per cent in the City of Edinburgh to 8 per cent in North Lanarkshire. With the sole exception of Glasgow City (where Asian-origin mothers made up the largest immigrant group), non-Scots-born mothers were most likely to have been born in the rest of the UK, with a high of 24 per cent of all births to non-Scots, UK-born mothers occurring in Moray (linked to military service personnel), followed by Scottish Borders (reflecting the high level of cross-border movement from England). Elsewhere, Argyll and Bute (21 per cent), Orkney Islands (19 per cent), City of Edinburgh and Aberdeenshire (17 per cent), Dumfries and Galloway and Stirling (16 per cent) and Highland all had more than 15 per cent of births to mothers born outside Scotland but in the UK. At the other extreme, North Lanarkshire had slightly less than 5 per cent and all the other seven older commercial and industrial areas within West Central Scotland (including, remarkably perhaps, Glasgow City itself), together with Dundee City all had less than 8 per cent of their mothers born elsewhere in the UK.
Figure 2.14 Percentage of all live births to mothers born outside Scotland by place of mother’s birth, Council area, 2001-05
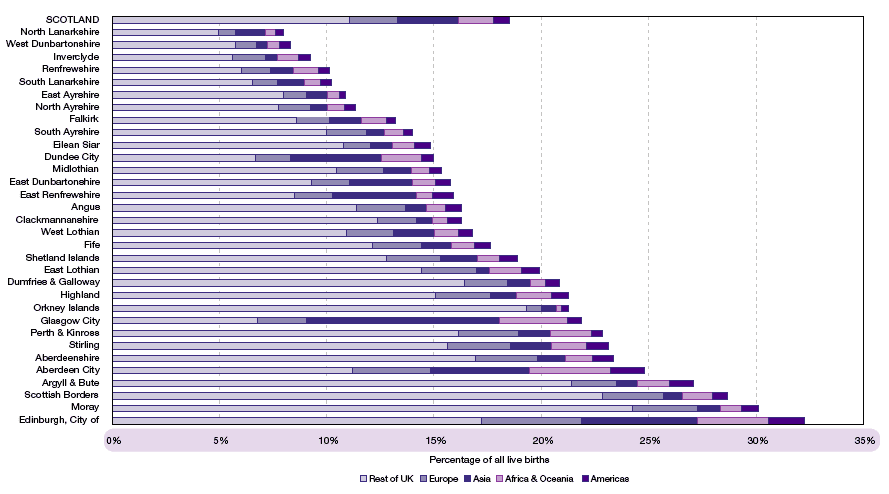
The highest concentrations of mothers born outside the United Kingdom were in Glasgow City (15 per cent) and City of Edinburgh (also 15 per cent), closely followed by Aberdeen City (14 per cent), Dundee City (8 per cent), Stirling (8 per cent) and East Renfrewshire (7 per cent and, as with Glasgow City, this Council area had a strong representation of mothers of Asian origin). By contrast, the remaining seven areas within West Central Scotland also had the lowest proportions of non-Scottish mothers and, along with Orkney and Clackmannanshire, all had less than four per cent of births to mothers not born anywhere in the UK.
Conclusion
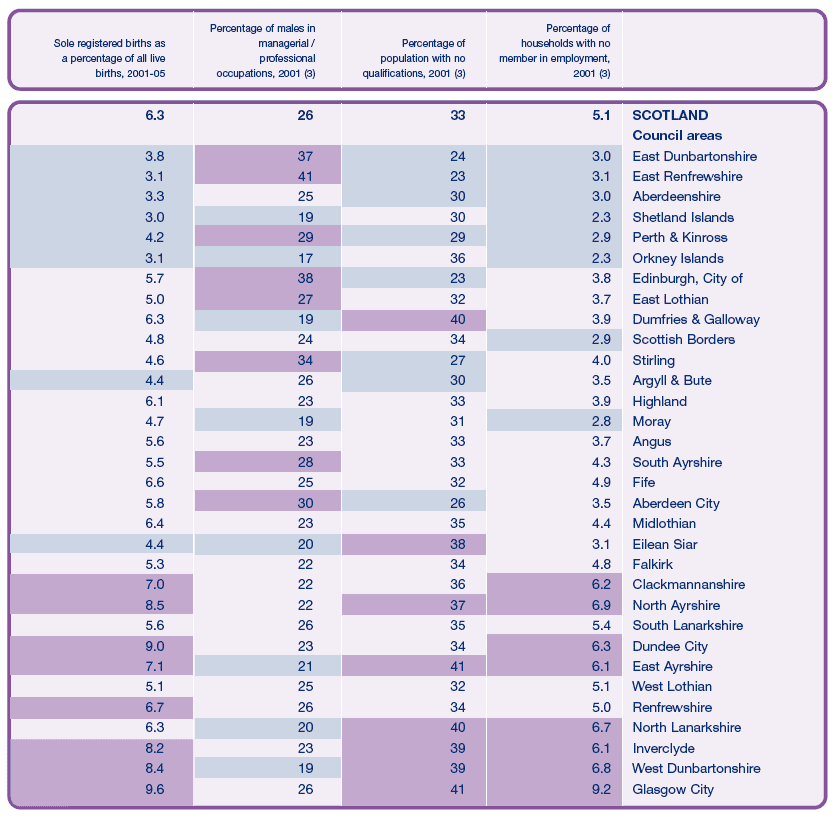
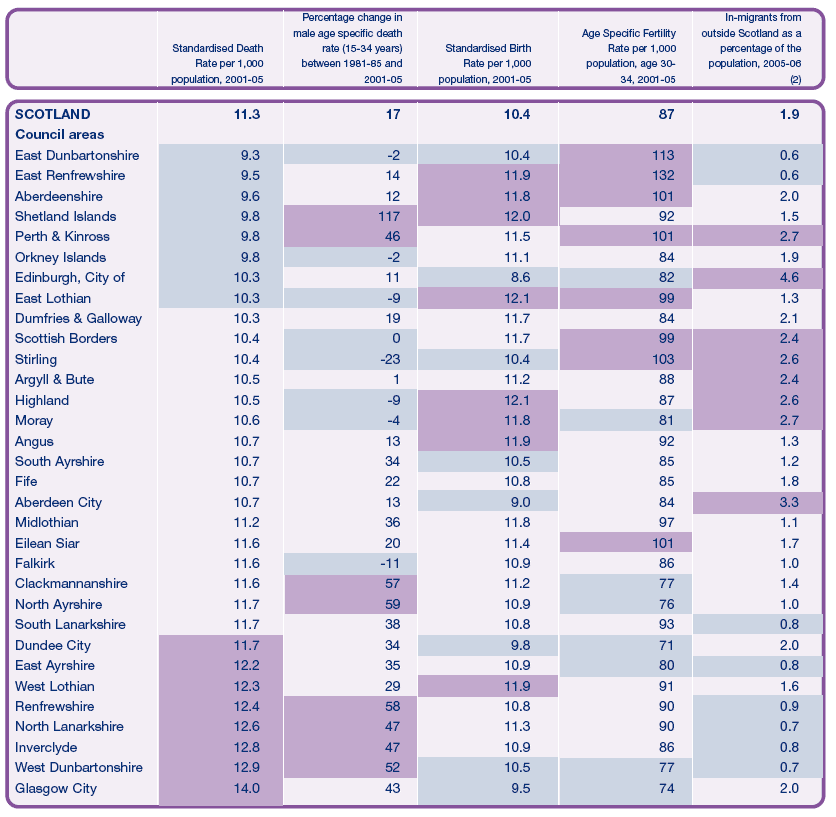
The discussion this far has explored the very substantial diversity between Council areas on a theme by theme basis. Table 2.5 draws together a number of strands to explore whether it is possible to identify a small number of relatively distinct demographic regimes within Scotland, and the extent to which these may be linked to underlying social characteristics of the areas concerned. The Council areas are rank-ordered by age-standardised death rates.
Table 2.5 shows that there are indeed very clear clusters of demographic behaviour in different groups of Council areas. Of the 12 authorities with the highest age-standardised mortality, eight are within what is here termed West Central Scotland, and the rest consist of a cluster of Clackmannanshire, Falkirk and West Lothian, plus Dundee City.
At the other extreme, the authorities with the lowest age-standardised mortality are East Dunbartonshire, East Renfrewshire, City of Edinburgh, East Lothian, Aberdeenshire and a number of more rural areas. When this ranking is compared with the last column, showing the percentage of households in the area at the time of the 2001 Census which had no member in employment, the similarities in rank ordering are very marked.
The most notable exception is West Lothian, as it appears to have a relatively high age-standardised death rate given its ranking on all the other variables in Table 2.5. This is most probably because West Lothian is on the late stages of a journey, from a past dominated by older heavy and extractive industries (and therefore rather like much of the Western Central Belt) towards a new situation as a relatively prosperous eastern authority. Its high age-standardised death rate is thus a relic of its past, impacted upon particularly by the experience of older individuals who still carry the legacy of their earlier life experiences.
Similar correlations between social and demographic factors can also be seen on some of the other variables. Most of the areas where young adult male mortality has increased so markedly over the past 25 years are also areas with high levels of unemployment and significant proportions of their populations declaring no qualifications at the 2001 Census. The biggest exception here is the Shetland Islands, with low unemployment and moderately strong levels of educational achievement, but a marked rise in young adult deaths and where particular local factors linked to the changing fortunes of local industries are probably significant.
The other dimension on which there is a very close correlation with measures of unemployment and educational qualification is sole registered births - also linked to some extent, as was shown earlier, to high levels of teenage pregnancy. Sole registered births are heavily clustered in the more westerly and former extractive and heavy manufacturing areas of the Central Belt, and in Dundee. These are also areas (in contrast to areas with relatively low unemployment and higher levels of educational attainment) where women are less likely to be following the more recent pattern of delaying childbirth until after the age of thirty.
In other areas of fertility, there is a very marked linkage between the same areas and high levels of fertility among rather older women - though on this variable, as it does for sole registered births, Eilean Siar stands out as an area in which older patterns of late childbirth and low levels of fertility outwith marriage remain significant.
However, overall patterns of fertility are less clearly linked to indicators of deprivation and its obverse. As was noted earlier, once fertility is standardised for the age composition of the population, it is the commuter and surrounding areas of the cities that show up the highest rates, accompanied by most of the more rural authority areas. By contrast, all the city cores show markedly lower figures.
Finally, the measures of migration used in this Chapter reveal marked contrasts between the Western Central Belt and the rest of the country, and in this case even East Dunbartonshire and East Renfrewshire are clearly part of a general West Central Scotland pattern. This is particularly the case for immigration from outside Scotland, and even more so for migration from outside the UK. In Table 2.5 the indicator used is ‘In-migrants from outside Scotland as a percentage of the population, 2005-06’. Ignoring Glasgow City, all the lowest figures are for the West Central Scotland area. Moreover, the fact that East Renfrewshire and East Dunbartonshire, the Council areas with the highest and third highest proportions of their populations in professional and managerial employment, had the lowest overseas in-migrant rates in Scotland is very striking, and especially so when compared with the other cities and their surrounding authorities.
This is one further indicator of one of the major conclusions of this chapter - that West Central Scotland as a whole, and even its most prosperous areas, tends to have a strong relative lack of demographic dynamism compared with almost all of the rest of Scotland. The political, economic, social, cultural and historical origins of this longstanding pattern and its continuation today take us beyond the remit of this chapter but it clearly merits further thought and action. This conclusion is reinforced by the fact that most areas within this region have experienced relative deterioration of their demographic performance on a number of key variables over the past 25 years, especially, but not only, in mortality. This contrast in dynamism is particularly marked between Glasgow City in the west and the eastern cities of Edinburgh and Aberdeen.
This is part of a second major conclusion to our review, which is that, on most of the variables that we can measure over the medium term, the differences between different parts of the country have increased rather than declined. This is particularly true of some key aspects of mortality. But, for example, it can also be observed in the age of childbirth. One aspect of this is a growing differentiation between all the four large cities and their surrounding Council areas. Another is the highly anomalous position of Eilean Siar, a rural authority with relatively low levels of households with no-one in employment, but where age-standardised mortality has improved little over the period of this review and where patterns of delayed and within-marriage fertility strongly persist to this day.
A final conclusion, which is particularly visible if the very different age structures of different Council areas are taken into account, is that, alongside the suburban and feeder Council areas of the major cities, Scotland’s rural Council areas are the most demographically dynamic areas. Their underlying birth rates are among the highest, and their underlying death rates (with the exception of Eilean Siar) are among the lowest. Most are also areas of significant in-migration, not only from elsewhere in Scotland but also from further afield. The factors underlying these encouraging patterns of rural demographic dynamism in Scotland merit further investigation.
Table 2.5 Summary of important demographic and economic indicators by Council area1
(1) - In each category, the highest 8 values have been shaded in
purple and the lowest 8 values have been shaded in light blue
(2) - Based on 2005-06 Community Health Index (CHI) data
(3) - Based on 2001 Census data
Table 2.5 Summary of important demographic and economic indicators by Council area1
