There were 27,547 marriages in Scotland in 2013, 2,987 (9.8 per cent) fewer than in 2012.
Figure 6.1 shows that, following a decline from over 40,000 marriages a year in the early 1970s, the annual total levelled out at around 30,000 in the mid-1990s. It fell each year from 2005 to 2009 and had increased in each of the years 2010-2012. The highest total recorded in recent years was 32,154 in 2004 (the highest total since 1993), whilst the highest ever recorded was 53,522 in 1940. The 2009 total (27,524) was the lowest since Victorian times, and the lowest ever recorded was 19,655 in 1858.
The information in this section covers all marriages registered in Scotland, regardless of where the bride and groom lived. In 2013, there were 6,200 'tourism' marriages (23 per cent of all marriages) where neither the bride nor groom was resident in Scotland. This represents a slight fall from 7,259 (24 per cent) in 2012. Almost half (49.6 per cent) of the 'tourism' marriages in 2013 were at Gretna.
Gretna continues to be a popular venue for marriages, although the 3,620 registered in 2013 (13 per cent of all marriages) was 11 per cent down on the number registered in 2012 (which although higher in number, was the same in percentage terms - 13 per cent of all marriages). The 2013 total is more than a third down on the record total of 5,555 in 2004 (17 per cent of all marriages in Scotland in 2004). Over the longer term, the number of marriages at Gretna increased from only 226 in 1981 through to 1,876 in 1991 and 5,033 in 2001. In 2013, 85 per cent (3,074) of the marriages at Gretna did not involve a Scots resident.
Of course, many couples who live in Scotland go abroad to be married. These marriages are not included, and only some come to the attention of the Registrar General through notification to British consular authorities.
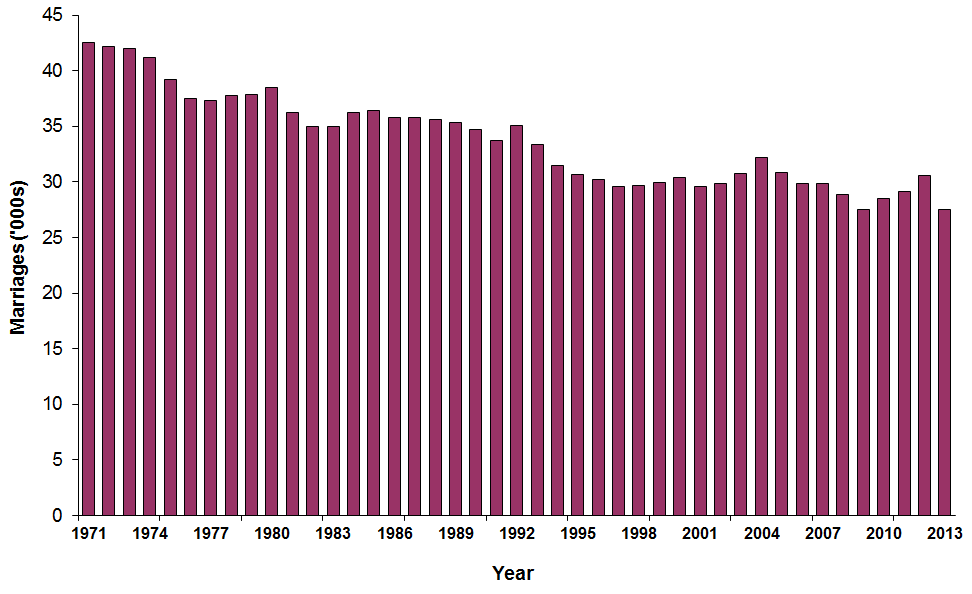
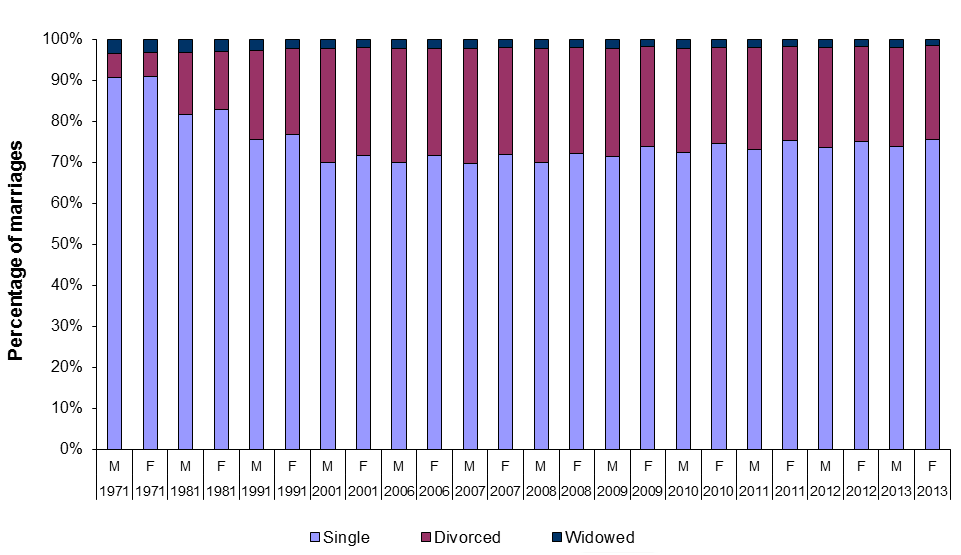
Figure 6.2 shows the percentage of marriages by marital status at the time of marriage between 1971 and 2013. The percentage of people marrying who had been divorced rose from just under 6 per cent in 1971, to over a quarter in 2001 (28 per cent for grooms and 26 per cent for brides). The majority of this shift reflects a reduction in the proportion of marriages where one of the partners had never been married. The proportion of those marrying who were divorced was 24 per cent in 2013 (24 per cent for grooms and 23 per cent for brides). The proportion of those marrying who were widowed (2 per cent in 2013) has hardly changed since 2001.
The average age at marriage has risen for both males and females. For first marriages, the average age of grooms who were bachelors has risen from 31.4 in 2003 to 33.0 in 2013; the comparable figures for brides who were spinsters are 29.4 in 2003 and 31.2 in 2013.
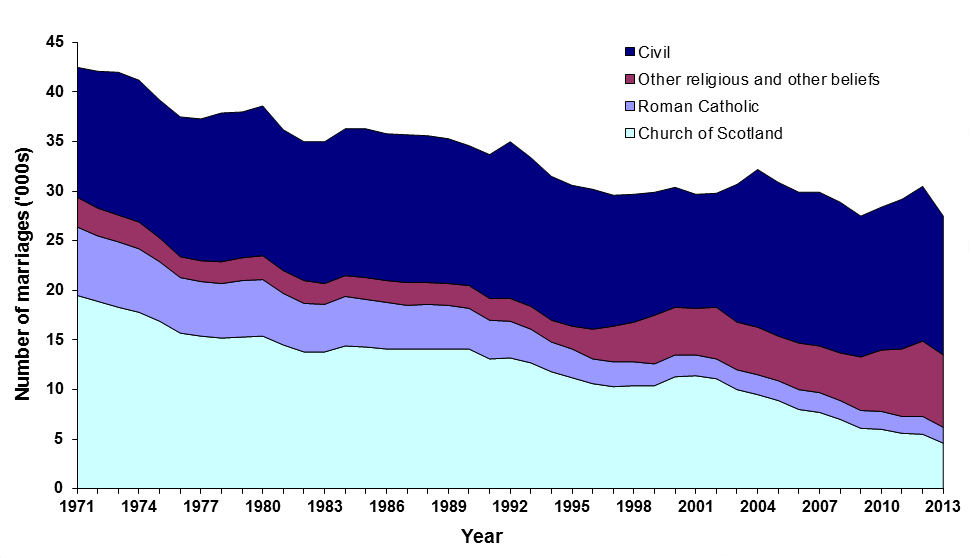
Civil marriages are conducted by registrars, and they have wide discretion over the form of the ceremony, to meet couples' wishes, as long as there are no religious references. There were 14,024 civil marriages in 2013, when they accounted for just over half (51 per cent) of all marriages compared to just under one-third (31 per cent) in 1971 (Figure 6.3).
The trend in civil marriages mainly reflects a decline in the number of religious ceremonies during the past 30 to 40 years. The small increase in religious marriages during the period 1997-2002 was largely associated with the increase of 'tourism' marriages, of which a significant proportion were carried out at Gretna. Since then, there has been a decrease in the number of religious and other belief marriages, from 16,890 in 2003 to 13,285 in 2009 followed by three annual increases to 14,942 in 2012 and a fall to 13,523 in 2013.
Religious marriages are conducted by a wide range of celebrants. The largest number of religious marriages were carried out by ministers of the Church of Scotland, who conducted 4,616 marriages in 2013. The other religious bodies conducting more than 500 marriages in 2013 were the Roman Catholic Church (1,582) and Assemblies of God (722). Humanist celebrants have been authorised to conduct marriages in Scotland since 2005. In 2013 they officiated at 3,185 marriages compared with 3,052 in 2012, 1,544 in 2009, and 434 in 2006.
Until 2002, civil marriages could only be held in registration offices. The Marriage (Scotland) Act 2002 allowed registrars to conduct ceremonies in other approved places, from June 2002. In 2003, the first full year of these arrangements, 3,465 ceremonies were carried out at these approved places. In June 2014, there were nearly 800 approved venues in Scotland, including castles, hotels, clubs and a small number of outdoor venues in gardens or the countryside. During 2013, 7,557 civil ceremonies (27 per cent of all marriages and 54 per cent of civil marriages) were conducted at these approved places. These proportions were similar to those in 2012.
In 2013, around 43 per cent of religious marriages were celebrated in places of worship while 46 per cent of civil marriages took place in registration offices.
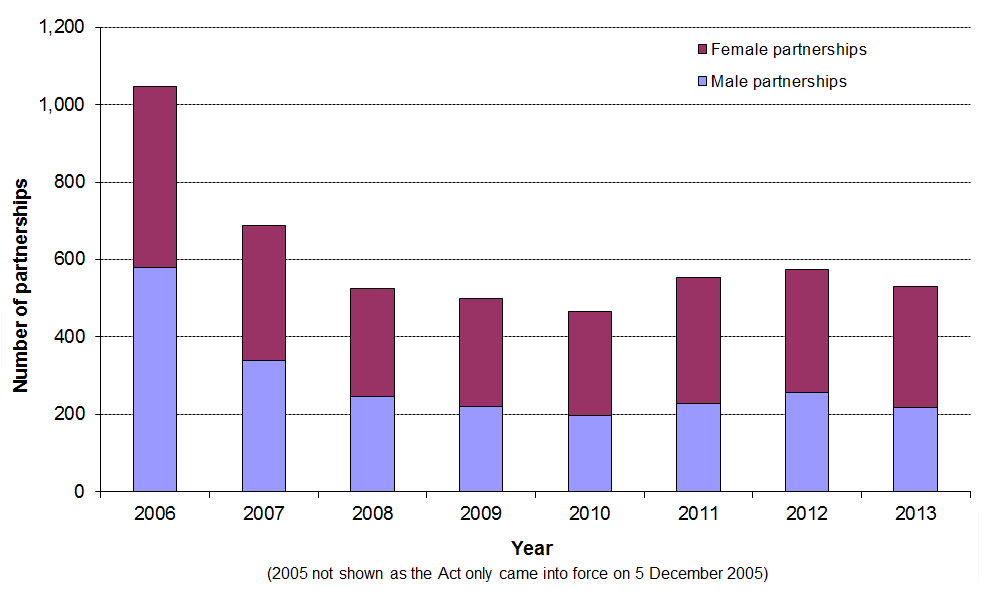
There were 530 civil partnerships registered in Scotland in 2013, 44 (7.7 per cent) fewer than in 2012.
The Civil Partnership Act 2004, which applies throughout the UK and came into force on 5 December 2005, allows same-sex couples to register their partnership.
During 2006, the first full year of operation, 1,047 partnerships were registered in Scotland. In 2007, 688 partnerships were registered. This decrease was expected, because many long-standing relationships would have been registered as civil partnerships in the first full year of registration. The number of partnerships formed continued to fall to 465 in 2010. In 2011 and 2012 there were 554 and 574 registrations respectively; the first years to show an increase. In 2013 there was a small fall in the number of partnerships, to 530, with 217 male partnerships and 313 female partnerships formed (Figure 6.4).
More detailed information about Scotland's marriages and civil partnerships can be found within the following sections of the NRS website:
Marriages and Civil Partnerships and Marriages and civil partnership section of the Vital Events Reference Tables 2013.
There are no figures for divorces and dissolutions of civil partnerships in this publication, because the Scottish Government is now the only publisher of new statistics of divorces and dissolutions for Scotland.