NB: these figures were calculated using the annual average number of drug-deaths for 2009-2013
and the estimated numbers of problem drug users for 2009/10
the figure for Greater Glasgow & Clyde is likely to be an under-estimate,
and the figure for Lanarkshire is likely to be an over-estimate - see the text
The 'error bars' indicate the likely ranges of values - see the text
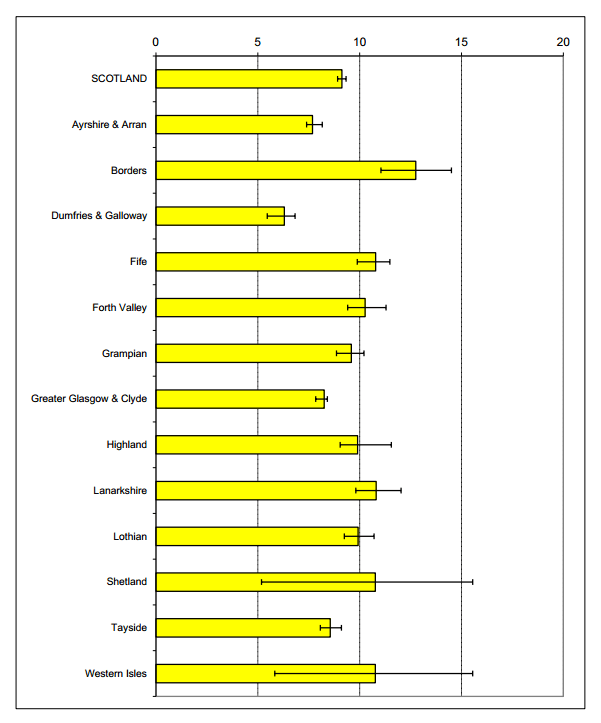
NB: figures for Orkney are not available - see Table HB5 and paragraph 4.7