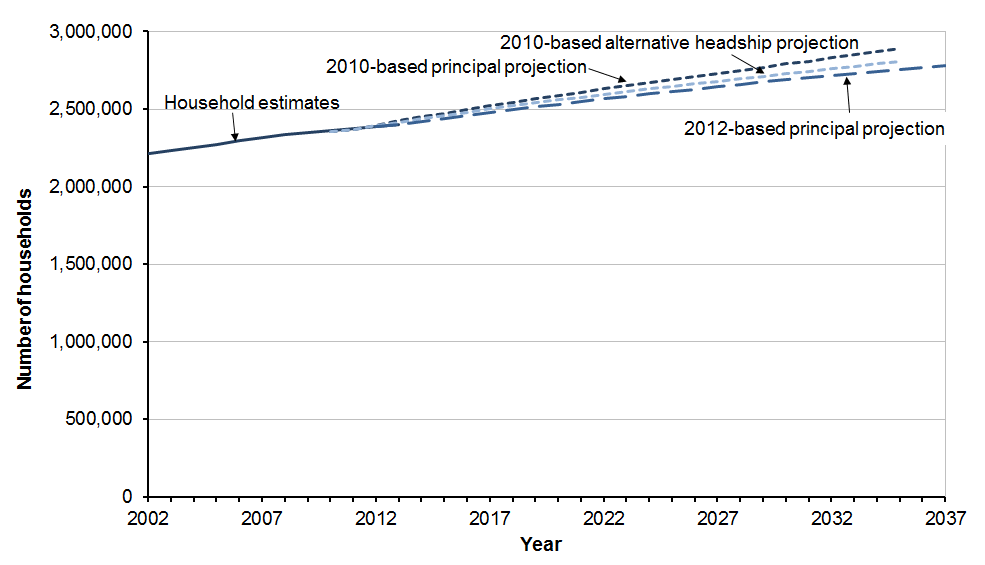
3.1.1 Household projections for Scotland are published every two years and cover a 25-year period. Figure 14 compares the total number of households projected in the latest (2012-based) principal household projection with the 2010-based principal projection. An additional 2010-based projection is also shown, the alternative headship variant. This variant projection made the assumption that headship rates from 2002 onwards would change at half the rate used in the principal projection. For more details go to ‘Household Projections for Scotland, 2010-based’ on the NRS website.
3.1.2 The 2010-based principal projection suggested an average annual increase of around 21,230 households per year between 2010 and 2035. However, Scottish Household Survey results at the time suggested that the decline in average household size was not occurring as quickly as projected. As 2011 Census data was not yet available to reflect this change in trends in more recent years, the alternative headship variant was produced, to project slower rates of household growth. This projected an annual average increase of 17,990 households. The 2012-based projections have a lower projected average increase than both sets of 2010-based projections, only projecting an average annual increase of 15,820.
3.1.3 Part of the reason for this lower rate of projected change is the inclusion of headship rate data from the 2011 Census in the 2012-based projections. Results from the 2011 Census confirmed what survey data had suggested, that there was less change in the types of household people in Scotland live in between 2001 and 2011 than there was between 1991 and 2001. Therefore the 2010-based projections were over-projecting the increase in smaller households and the decrease in larger households1. Including data from the 2011 Census means that projected headship rates do not change as quickly as in the 2010-based projections.
3.1.4 The deviation from what was suggested by projecting forward information from the 1991 and 2001 Censuses is likely to reflect the economic downturn which began in 2008, as discussed in Sections 2.1 and 4. Information from the 1991 and 2001 Censuses is still used in the 2012-based households projections to reflect longer-term trends and because it isn’t clear yet whether the changes seen after 2008 will continue once economic recovery is better established. Survey data on household type is used to assign weights to projections based on the 1991 and 2001 Censuses and the 2001 and 2011 Censuses. This enables us to incorporate the most recent trends in household formation.
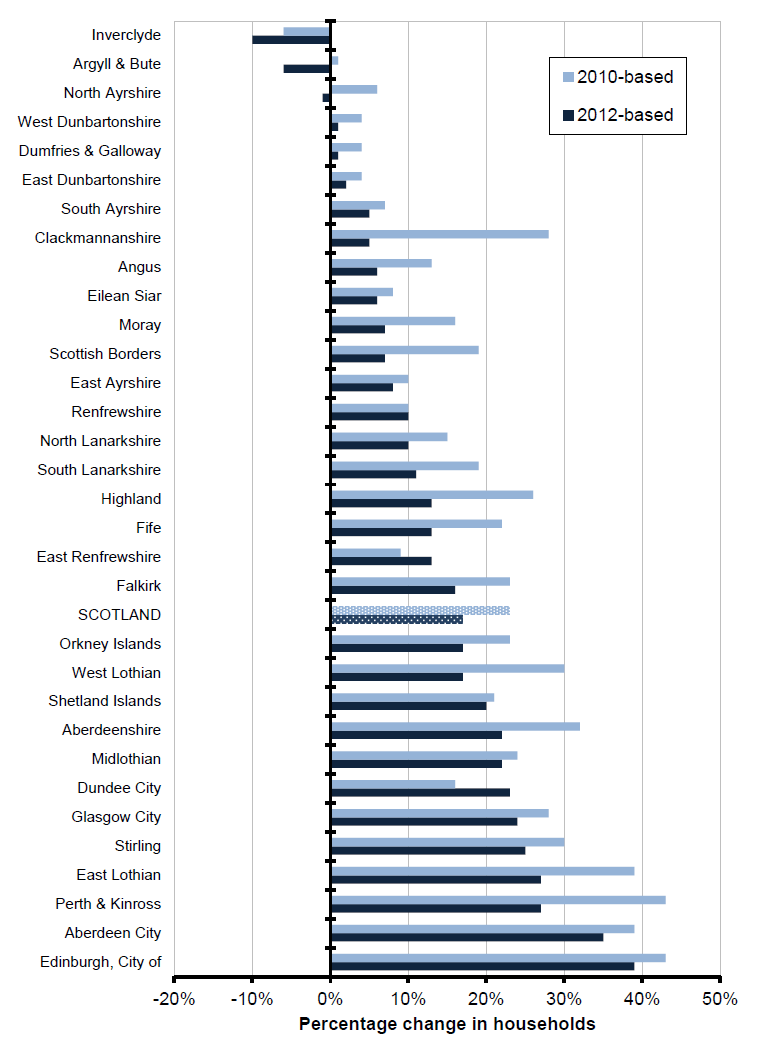
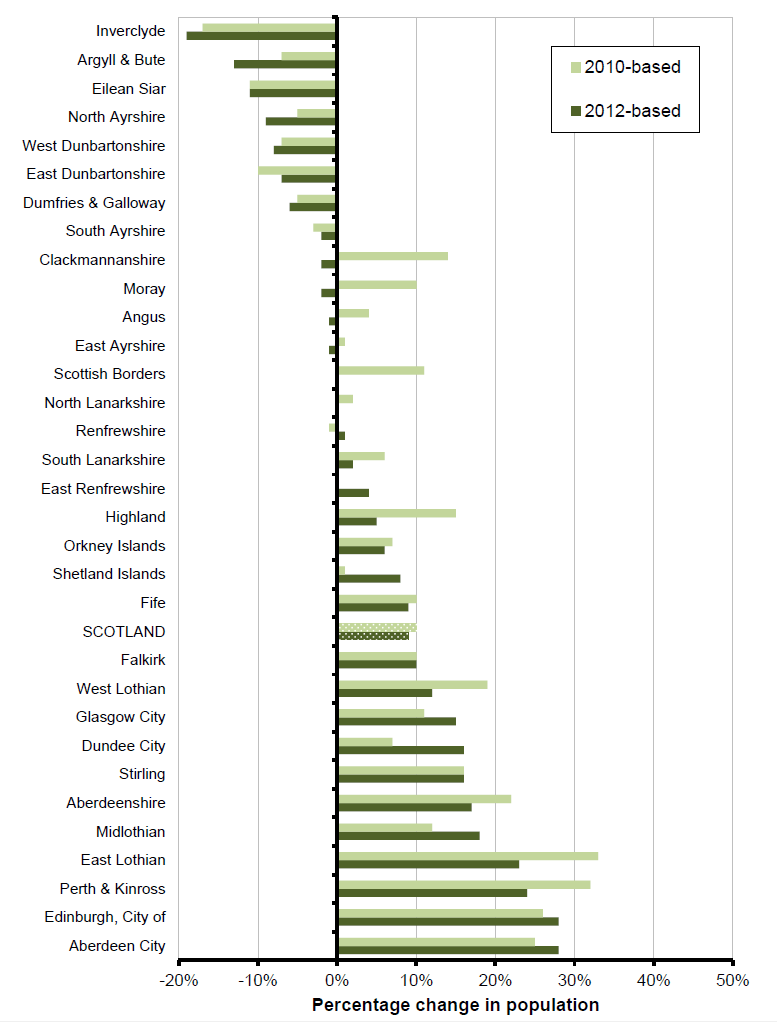
3.1.5 Changes in the population projections also have a considerable effect on the household projections. Figure 15 shows the percentage change in the 2010 and 2012-based household projections for each Council area, while Figure 16 shows the equivalent figures from the population projections.
3.1.6 The 2012-based population projections were lower than the 2010-based projections for the majority of Council areas as well as for Scotland as a whole. The differences in the population projections are down to the incorporation of 2011 Census results, in both the base year and in the assumptions made about birth rates, mortality and migration. For some Council areas it is particularly clear that differences in the 2010 and 2012-based population projections account for much of the differences between the 2010 and 2012-based household projections. For example, the number of households in Clackmannanshire is projected to increase by five per cent in the 2012-based projection compared to an increase of 28 per cent in the 2010-based projections. However there is also a large difference in the two sets of population projections for Clackmannanshire, with the 2012-based projections showing a two per cent decrease compared to a 14 per cent increase in the 2010-based projection.
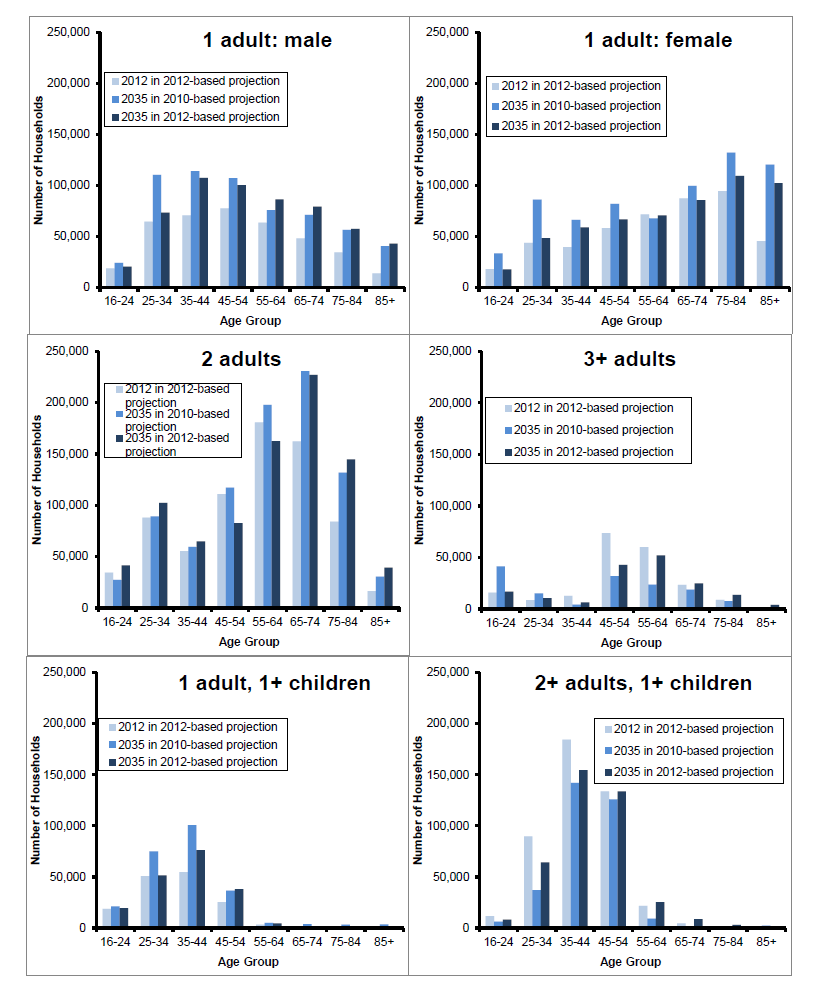
3.1.7 As well as projecting a lower total number of households in the 2012-based projections, there are some differences in the types of households being projected and the age of the heads of households when compared to the 2010-based projection. Figure 17 compares the projected number of households in 2035 in the 2010 and 2012-based projections, broken down by household type and age of head of household.
3.1.8 In the 2010-based projections large increases in the number of one adult households were projected for young adults of both sexes, however this is no longer the case in the 2012-based projections. This is likely to be due to the economic downturn making it more difficult for young adults to afford to live on their own. In older age groups the 2012-based projections have more males living alone than the 2010-based projections and fewer females living alone. This is mostly due to changes in assumptions for mortality rates in the population projections, reflecting the fact that the difference in life expectancy for males and females is falling.
3.1.9 The 2012-based projection also projects more households containing three or more adults, or two or more adults with children, headed by someone aged 45 to 74 than the 2010-based projection. Again, this is partly due to the economic downturn making it more difficult for young adults to afford to move, meaning that they are more likely to live at home with parents, as discussed in Section 4.
Footnotes: