3.1.1 Figure 1 shows that the expectation of life at birth in Scotland has improved over the last 20 years or so. It has increased from 69.3 years for males and 75.5 years for females born in the period 1981-1983 to 74.8 years and 79.7 years respectively for those born in 2005-2007, an increase of 5.5 years and 4.2 years respectively.
Figure 1 Life expectancy at birth, Scotland, 1981-1983 to 2005-2007
3.1.2 Figure 1 also shows that the gap between males and females is slowly closing, dropping from 6.2 years in 1981-1983 to 4.9 years in 2005-2007.
3.1.3 Alternative, but very similar, results for Scotland are also produced by the Office for National Statistics (ONS) using single years of age rather than grouped years. For more details see Section 4.1.
3.1.4 Figure 2 shows that Scottish men and women have among the lowest expectation of life at birth in the EU-271. The countries with lower life expectancy than Scotland were most of the Eastern European states which joined the EU on 1 May 2004 and 1 January 2007. For Scottish males, expectation of life is 0.4 years lower than the EU average. For females, life expectancy is almost 2 years lower. For both sexes, the expectation of life is between 4 to 5 years lower than the countries with the highest expectation of life.
3.1.5 The average life expectancy at birth for the whole of the UK is 77.1 years for men and 81.1 years for women. Only 3 Scottish council areas have higher male life expectancy than the UK average - East Renfrewshire, Aberdeenshire and East Dunbartonshire. For females, the same 3 council areas plus Perth & Kinross, Orkney Islands and Shetland Islands have higher life expectancy than the UK average.
Figure 2 Life Expectancy at birth, 2006, selected countries
Males
(1) 2004
(2) 2005
(3) 2005-2007
Source: EUROSTAT and GROS
Females
(1) 2004
(2) 2005
(3) 2005-2007
Source: EUROSTAT and GROS
3.2 Life Expectancy at Birth, 2005-2007
3.2.1 Table 1, Table 2 and Table 3 show life expectancy at birth in Scotland for 2005-2007 for council and NHS board areas.
3.2.2 For males, the council area with the lowest figure was Glasgow City (70.8 years). The council area with the highest life expectancy was East Dunbartonshire (78.0 years), 7.2 years more than Glasgow City.
3.2.3 Shetland has the highest life expectancy for females (82.6 years), 5.5 years more than Glasgow City, the area with the lowest figure (77.1 years).
3.2.4 Of the NHS board areas, the lowest figure for both males and females was for Greater Glasgow & Clyde (72.7 and 78.5 years respectively). The NHS board area with the highest male life expectancy was Borders (76.6 years) and the highest female life expectancy was Shetland (82.6 years).
3.2.5 Table 4 and Table 5 show expectation of life at an "exact age". This is the average number of years that those at this age will live thereafter. These extracts from period life tables are constructed from the estimated population in 2005, 2006 and 2007 and the total number of deaths registered in these years. The column headed lx shows the numbers who would survive to the exact age of x, out of 100,000 persons who, from birth, were subject to the mortality probabilities indicated by the death records for 2005-2007. The column headed exo shows the expectation of life, that is, the average number of years of life left to persons aged exactly x who are subject to the 2005-2007 mortality probabilities from age x onwards. For example, on this basis a male aged 80 living in Glasgow City could expect to live on average another 6.9 years, whereas a female aged 80 could expect to live on average another 8.4 years.
3.3 Life Expectancy at age 65, 2005-2007
3.3.1 Table 6 shows life expectancy at age 65 for Scotland and its administrative areas and has been ranked for ease of presentation. This shows that males aged 65 could expect to live a further 16.1 years and females a further 18.8 years if mortality rates remain the same as they were in the period 2005-2007.
3.3.2 For males and females the council area with the lowest figure was Glasgow City (13.8 years and 17.4 years respectively). The council area with the highest life expectancy at age 65 for both males and females was Shetland (18.4 years and 21.0 years respectively), 4.6 years for males and 3.6 for females years more than Glasgow City.
3.3.3 For males and females the NHS board area with the lowest figure was Greater Glasgow & Clyde (14.9 years and 18.0 years respectively). The NHS board area with the highest life expectancy at age 65 for males and females was Shetland (18.4 years and 21.0 years respectively), 3.5 years for males and 3.0 years for females more than Greater Glasgow & Clyde.
3.4.1 Life expectancy at birth, like most statistics, is an estimate which is subject to a margin of error. The accuracy of the results can be indicated by calculating a confidence interval which provides a range of values within which the true underlying life expectancy would lie (with 95% probability).
3.4.2 The 95% confidence intervals for life expectancy at birth and at age 65 are given in Table 7 and Table 8, and are illustrated in Figure 3, Figure 4, Figure 5 and Figure 6 for council and NHS board areas within Scotland.
3.4.3 There is no simple "rule of thumb" for the size of confidence intervals, although it largely depends upon the size of the population, and so confidence intervals for areas with small populations tend to be wider. It is also worth noting that life expectancy results in these areas can be affected by the random variation in the annual number of deaths. This means that the results can be erratic and vary from period to period. For example, in table 1, table 2 and table 3, changes in rank may be due to random variation from year to year in the population and number of deaths (particularly in the smaller areas such as Orkney and Shetland) as opposed to a real change in the number of years one can expect to live.
3.4.4 More information about the methods used to calculate the standard errors and confidence intervals used in this report can be found in the ONS methodology paper "Life expectancy at birth: methodological options for small populations". See Section 4.2.3 for how to access this report.
Figure 3 Life expectancy at birth, 95% confidence intervals for council areas, 2005-2007 (Males & Females)
Figure 4 Life expectancy at birth, 95% confidence intervals for NHS board areas, 2005-2007 (Males & Females)
Figure 5 Life expectancy at age 65, 95% confidence intervals for council areas, 2005-2007 (Males & Females)
Figure 6 Life expectancy at age 65, 95% confidence intervals for NHS board areas, 2005-2007 (Males & Females)
3.5 Comparisons between 1995-1997 and 2005-2007
3.5.1 Life expectancy at birth in Scotland has increased between 1995-1997 and 2005-2007, from 72.3 years to 74.8 years for males, and from 77.9 years to 79.7 years for females. Table 1, Table 2 and Table 3 also show the highest and lowest ranking council and NHS board area for both periods. The tables show the gap between males and females is closing, from 5.6 years in 1995-1997 to 4.9 years in 2005-2007. For council areas, the gap between highest and lowest areas for male life expectancy at birth has decreased by 0.3 years – from 7.5 years in 1995-1997 to 7.2 years in 2005-2007. For females, the gap has increased (from 4.8 years in 1995-1997 to 5.5 years in 2005-2007).
3.5.2 The maps in Figure 7a and Figure 7b and the charts in Figure 7c show the percentage change in life expectancy over the 10 year period for council areas. For males, the Shetland Islands had the largest increase with 5.5 per cent (4.0 years) and Clackmannanshire the lowest with 1.9 per cent (1.4 years). For females, East Dunbartonshire had the largest increase with 4.2 per cent (3.4 years) and East Ayrshire the lowest with 0.7 per cent (0.5 years).
3.5.3 The maps in Figure 8a and Figure 8b and the charts in Figure 8c show similar information for NHS board areas. For males, Shetland had the largest increase with 5.5 per cent (4.0 years) and Orkney the lowest with 2.0 per cent (1.4 years). For females, Shetland had the largest increase with 3.2 per cent (2.5 years) and Grampian and Dumfries & Galloway the lowest with 1.5 per cent (1.2 years).
3.5.4 Over the 10 year period, the ranking of many council and NHS boards has changed (Table 1, Table 2 and Table 3). For males, Shetland council area has risen 13 places to 11th while Orkney and Angus have fallen 8 places to 20th and 13th respectively. East Dunbartonshire has replaced East Renfrewshire as the council area ranked number 1 for male life expectancy. For females, South Ayrshire and Stirling have risen 9 places to 11th and 9th respectively, while Moray has fallen 13 places to 17th. Shetland has replaced Aberdeenshire as the council area ranked number 1 for female life expectancy.
3.5.5 Of the NHS boards, Shetland has risen 7 places to 4th and Orkney has fallen 6 places to 10th for males. For females, Lothian has risen 5 places to 5th and Dumfries & Galloway has fallen 4 places to 9th. Borders remains at rank 1 for male life expectancy as does Shetland for female life expectancy.
3.5.6 When confidence intervals for the results are taken into account, the rise and fall of the rankings over time are not exact, especially for areas with relatively small populations such as Orkney and Shetland. Confidence intervals for 1995-1997 are not presented here, but male and female figures are available from the Office for National Statistics (ONS) website through the following link: http://www.statistics.gov.uk/downloads/theme_population/LE_Scotland_2007.xls
Figure 7a Percentage change in life expectancy at birth between 1995-1997 and 2005-2007, council areas, Males
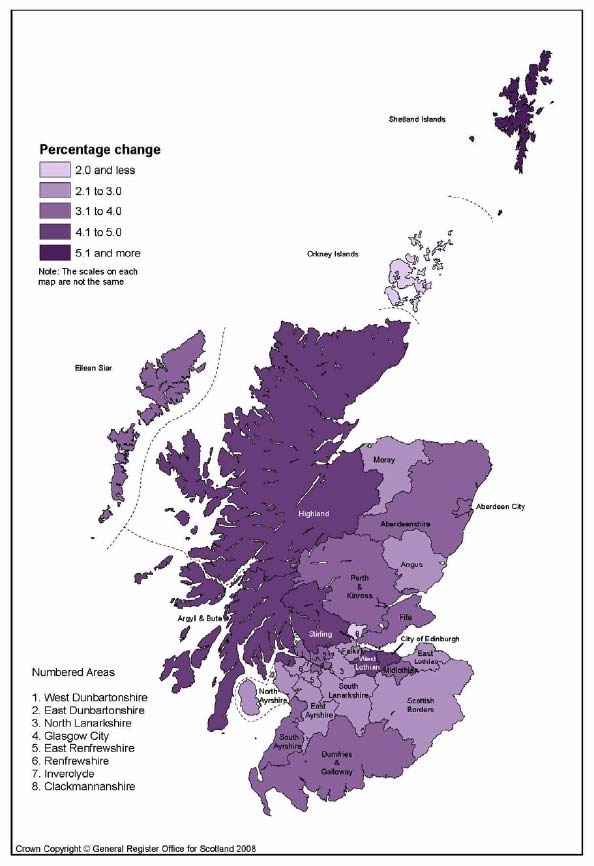
Figure 7b Percentage change in life expectancy at birth between 1995-1997 and 2005-2007, council areas, Females
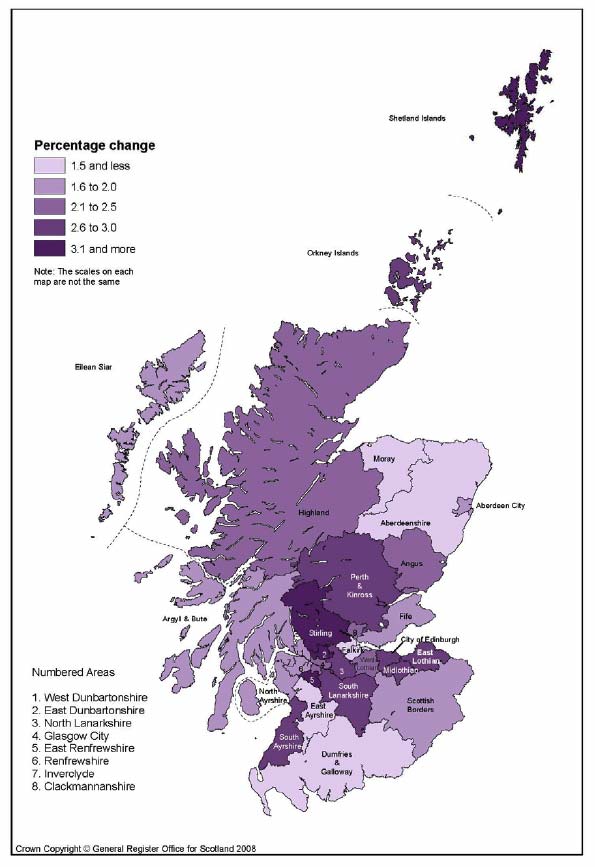
Figure 7c Percentage change in life expectancy at birth between 1995-1997 and 2005-2007, council areas, Males and Females
Males
Figure 8a Percentage change in life expectancy at birth between 1995-1997 and 2005-2007, NHS board areas, Males
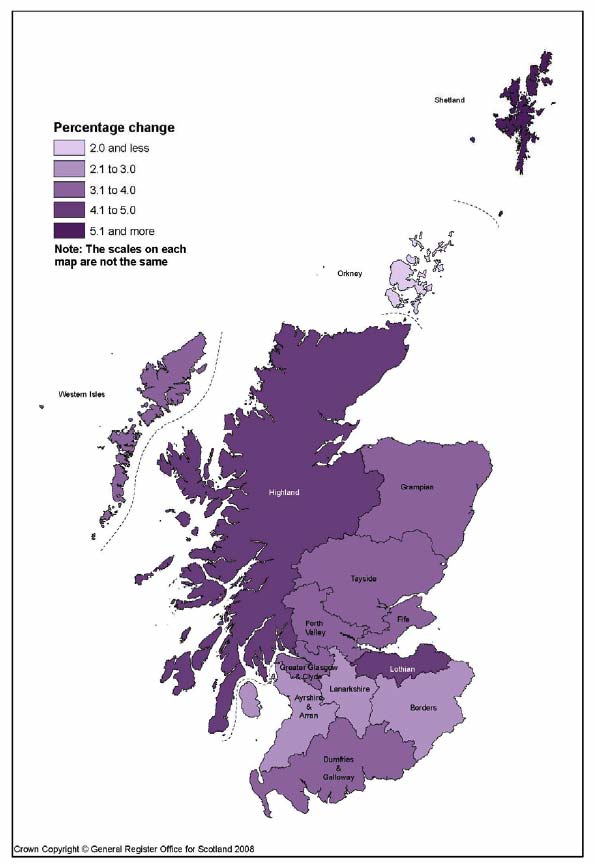
Figure 8b Percentage change in life expectancy at birth between 1995-1997 and 2005-2007, NHS board areas, Females
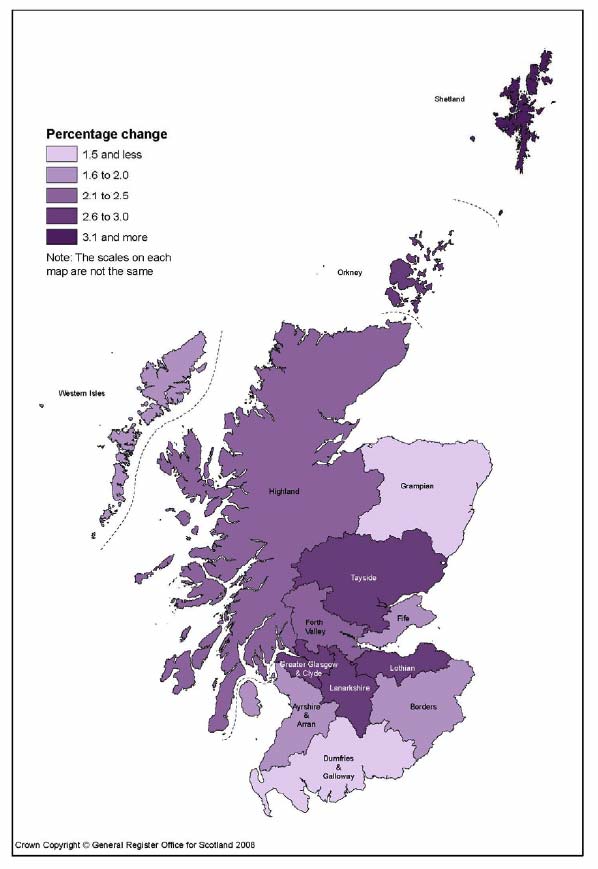
Figure 8c Percentage change in life expectancy at birth between 1995-1997 and 2005-2007, NHS board areas, Males and Females
Males
Females