7.1 Figure 6 shows the projected number of households in 2006 and 2031, by age of head of household (normally the first person entered on the census form). Detailed information for the age of the head of household can also be seen in Tables 6a to 6d. The ageing population, with a projected increase in the number of people in the older age groups, and fewer people in the younger age groups, is reflected in the household projections, with the largest increases in households headed by people aged 60 and over. Between 2006 and 2031, the projected percentage increases for households headed by people aged 60 and over range from 41 per cent in Glasgow & Clyde Valley SDP area, to 74 per cent in Aberdeen City & Shire SDP area.
7.2 Projected changes in households headed by people aged under 60 are smaller and vary more across the country. Small increases of two cent are projected for Glasgow & Clyde Valley and TAYplan SDP areas, with a larger increase of 19 per cent in SESplan SDP area. A decrease of five per cent is projected for Aberdeen City & Shire SDP area.
7.3 Between 2006 and 2031, there are large projected increases in the number of households headed by someone aged 85 or over in all the SDP areas, from 134 per cent in Glasgow & Clyde Valley SDP area to 177 per cent in Aberdeen City & Shire SDP area.
Figure 6: Projected numbers of households in SDP areas by age of head of household, 2006 and 2031
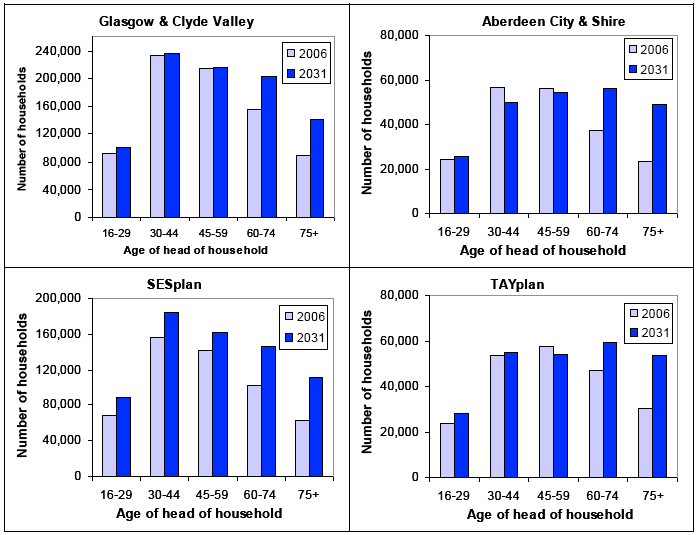
Please note that scales on the y-axis differ between graphs.