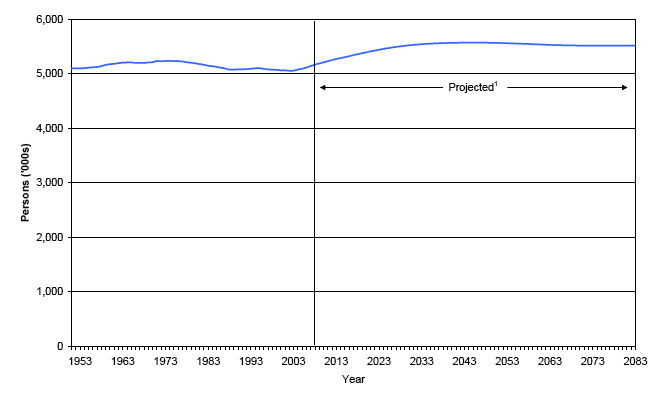
2.1 The results of this new set of projections, summarised in Table 1 and illustrated in Figure 1, show the total population of Scotland increasing from 5.17 million in 2008 and rising above Scotland’s record 1974 population of 5.24 million in 2012. After this, it is projected to reach 5.36 million in 2018 (an increase of 191,000 or 4 per cent compared to 2008) and then 5.54 million by 2033 (a 7 per cent increase on the 2008 level). Looking further ahead, the population is projected to continue to rise until it peaks at around 5.57 million in the mid 2040s. It is then projected to decline slowly but to remain well above its current level.
Figure 1 Estimated population of Scotland, actual and projected, 1951-2083
1 2008-based projection
2.2 Table 2 provides information on the projected components of change between 2008 and 2033. The table shows that up until around 2026 natural change and migration both act to increase the size of the population as the number of births exceeds the number of deaths and there are more immigrants than emigrants. After that point; the number of deaths exceeds the number of births whilst the net migration into Scotland continues.
Figure 2 Births and deaths, actual1 and projected, Scotland, 1951-2033
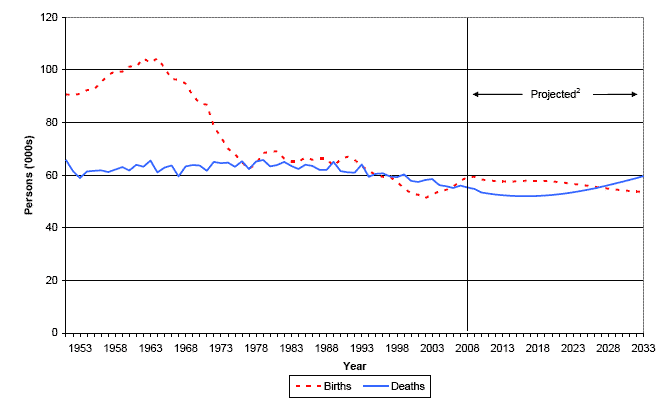
1 calendar year
2 2008-based mid-year projections
2.3 As Figure 2 shows, the number of births in Scotland fell significantly between the early 1960s and 2002, dropping below the number of deaths in 1996. The last few years have seen an upturn in the number of births and they have exceeded the number of deaths since 2007. The projections show a further increase in the number of births in 2009. Thereafter they generally decline but continue to exceed deaths until 2027 and remain above the historically low number of births observed in 2002 throughout the first 25 years of the projection. Meanwhile, the number of deaths is projected to fall until 2016 before increasing back to the levels experienced in the mid 1990s by about 2033.
Figure 3 Estimated and projected net migration, Scotland, 1951-2033
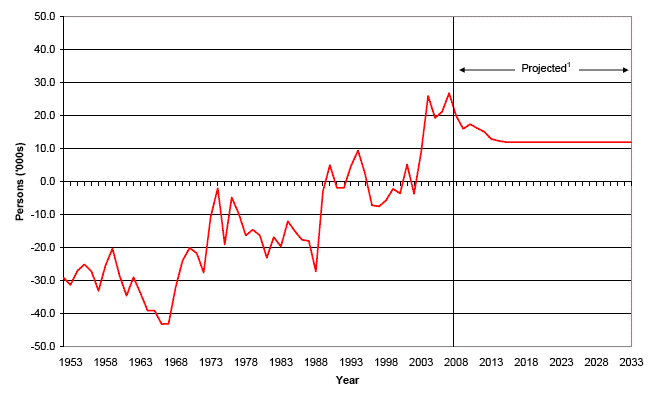
1 2008-based projections
2.4 As Figure 3 shows, Scotland has historically been a country of net out-migration with more people leaving than coming in the other direction. However, in the last few years Scotland has experienced record levels of net in-migration. As a result of these recent trends, these projections have assumed that Scotland will experience a net inflow throughout the projection period. The size of this net inflow is assumed to fall steadily for the first six years of the projection from its 2007-08 level of 20,000 until it reaches 12,000 in 2014-15 and stays at this level for the remainder of the projection period. More detailed information on the fertility, mortality and migration assumptions leading to these results is given in Section 3 and Annex A, Annex B and Annex C.
2.5 A summary of projected populations in broad age groups is given in Table 3; projected populations by sex and five year age groups are given in Table 6. These tables and Figure 4 show that the age structure of the population is projected to change markedly between 2008 and 2033.
Figure 4 The projected percentage change in Scotland’s population by age group, 2008-2033
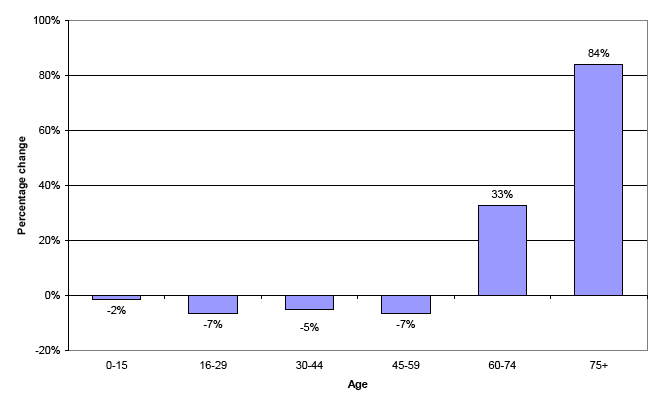
2.6 Scotland’s population is projected to increase by 7 per cent between 2008 and 2033. As Figure 4 shows, the number of younger people is projected to decrease during this period whilst the number of older people is projected to increase significantly.
2.7 Between 2008 and 2018, the number of children aged under 16 is projected to increase by 1 per cent from 0.91 to 0.92 million. It is then projected to decrease to 0.90 million in 2033 (a 1.5 per cent decrease compared to 2008).
2.8 The number of people of working age is projected to increase from 3.24 million in 2008 to 3.36 million in 2018 (an increase of 4 per cent). It is then projected to fall to 3.31 million in 2033 (an increase of around 2 per cent compared to 2008).
2.9 The number of people of pensionable age is projected to rise from 1.02 million in 2008 to 1.07 million in 2018 (an increase of 6 per cent). It is then projected to rise more rapidly, reaching 1.34 million in 2033 (an increase of around 31 per cent compared to 2008).
2.10 These figures take into account the increases in the state pension age which will rise from 60 to 65 for women between 2010 and 2020 and then from 65 to 66 for both men and women between 2024 and 2026. A further increase to age 68 for both men and women will occur between 2034 and 2046. Were it not for these changes the population of working age would be projected to decrease by around 6 per cent and the population of pensionable age to increase by 57 per cent by 2033.
2.11 The number of people aged 75 and over is projected to increase by around 23 per cent from 0.39 million in 2008 to 0.48 million in 2018. It is then projected to continue rising, reaching 0.72 million in 2033 - an increase of 84 per cent over the 25 year period. This is due to the ageing of the baby boomers born after the Second World War, in their mid eighties by 2033, and the effect of improved mortality rates.
2.12 A useful summary measure of the age structure of a population is the dependency ratio - the ratio of persons aged under 16 and those over pensionable age to those of working age. Table 4 shows that the dependency ratio is projected to remain more or less stable at around 60 per 100 until 2018. Between 2018 and 2023 the dependency ratio is projected to increase to 62 per 100 working age population. It then remains more or less steady until 2028 before increasing relatively rapidly to 68 by 2033. The relatively slow initial increase in the dependency ratio is mainly due to the changes to the state pension age described above. In the absence of these changes, the dependency ratio would be projected to rise to 82 per 100 by 2033.
2.13 In 2008 the 60 dependents per 100 working age population were made up relatively evenly of children (28 per 100) and pensioners (31 per 100). By 2033 this distribution is projected to have changed with 27 children and 40 pensioners per 100 population of working age.