Chapter 1: Deaths Related to COVID-19
"There have been 4,257 deaths involving COVID-19 as at 27 September 2020.”
Introduction
Scotland continues to be challenged by the wide ranging impact of COVID-19. This chapter brings together the evidence and learning that National Records of Scotland (NRS) has gathered through its registered deaths data between mid-March and mid-September. In providing this overview, NRS’s aim is to draw together our understanding of how COVID-19 related mortality impacted and spread across Scotland. This information provides a summary which allows a clearer understanding of what has happened, and may also inform further planning and support.
This chapter explores the key findings from NRS analysis. A summary of these are:
- COVID-19 related mortality increased sharply in the first 6 weeks of the pandemic and then fell at a slower rate, taking 11 weeks to get back to the level seen in the first week. Since then numbers have remained very low.
- The oldest age groups have been most affected, with more than three quarters of deaths among those aged 75 and over.
-
After adjusting for age:
- Males were 1.4 times as likely to die than females
- People in large urban areas were more than 4 times as likely to die than those in remote rural areas
- People in the most deprived areas were over twice as likely to die as those in the least deprived areas
- In the early stages of the pandemic most deaths took place in hospitals but this was then overtaken by care home deaths. The proportion of COVID-19 deaths in each of these settings is now almost equal at 47% and 46%, with only 7% of COVID-19 deaths taking place at home or in a non-institutional setting.
Many of these factors are interdependent, for example, the relationship between urban mortality and deprivation, however each serve to highlight the overall impact of COVID-19 related mortality on Scotland, and how it has changed during the past 6 months.
Different ways of measuring the impact of COVID-19 on deaths
There are 3 key measures of deaths involving COVID-19. The first – deaths within 28 days of the first positive COVID-19 test – has been reported daily on the Scottish Government website. This measure reports on deaths registered up to the previous day and provided valuable early information on COVID-19 deaths, especially in the earlier stages of the pandemic.
The second is deaths where COVID-19 is mentioned on the death certificate by the doctor who certified the death. This measure is more comprehensive as it includes those deaths where a test wasn’t necessarily carried out, but where the medical professional considered COVID-19 as being relevant to the cause of death. This was particularly the case during the earlier stages of the pandemic when testing was less widespread.
3 Measures
1 – Death within 28 days of the first positive COVID-19 test - the HPS measure
2 – Death where COVID-19 is mentioned on the death certificate (regardless of testing) – the NRS measure
3 – Excess deaths (deaths from all causes minus the 5 year average)
What are “Excess Deaths”?
The total number of deaths registered in a week in 2020 minus the average number of deaths registered in the same week over the period 2015 to 2019.
The third – excess deaths – is useful for measuring the broader impact of the pandemic on levels of mortality, picking up deaths which are directly and indirectly related to COVID-19. It is also a helpful measure when comparing with other countries as differences in definitions and death registration practices may make direct COVID-19 mortality comparisons misleading.
How many deaths have there been?
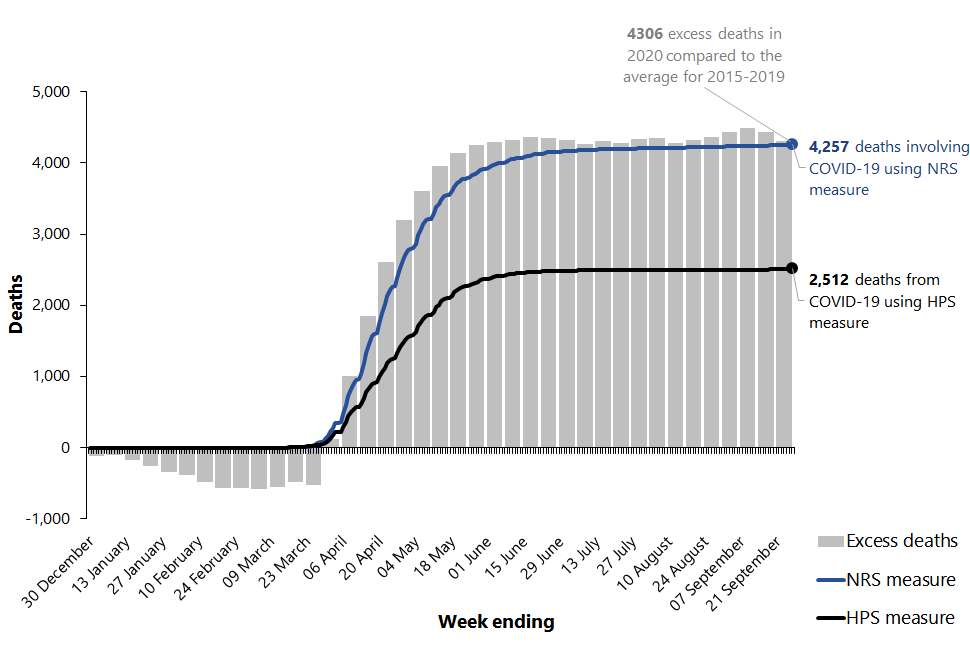
Since mid-March there have been 4,257 deaths registered where coronavirus was mentioned on the death certificate (the NRS measure). This compares to 2,512 deaths within 28 days of a positive test (the HPS measure).
As the NRS measure also includes deaths where the certifying doctor recorded probable or suspected COVID-19 without a positive test taking place, the number of deaths counted on this basis diverged from the HPS measure early in the pandemic.
The two measures have been broadly aligned since July, as the number of deaths reduced to low levels. Only a small number of additional deaths have since been captured by the NRS measure, largely due to people dying more than 28 days after their first positive test. Also, testing has become more widely available, increasing the likelihood of a COVID-19 death being included under both measures. Both of these figures are valuable: the HPS measure because it’s available earlier and gives an indication of those who are dying after catching the virus recently (within 28 days before their death); and the NRS measure because it allows more detailed analysis by linking to information such as location of death, underlying health conditions and so on.
Figure 1.1: Comparison of cumulative COVID-19 deaths using different measures
The third measure, excess deaths, is useful in assessing the wider impact of the pandemic, both directly (through deaths due to COVID-19) and indirectly (through changes in deaths due to other causes).
In the early part of 2020, the number of deaths was lower than the average number of deaths over 2015 to 2019 for the same period, meaning there were no excess deaths. In April, excess deaths began to increase rapidly and continued to be above average until mid-June after which point they returned to the average levels of the last 5 years. The cumulative number of excess deaths for the year to date remain considerably higher than usual with 4,306 more deaths registered (as at 27 September) than would have been the case if numbers were similar to the average over the last five year years.
Ninety-one percent of excess deaths had COVID-19 recorded as the underlying cause of death. However, the remaining proportion of excess deaths were due to other causes.
A report by Public Health Scotland has looked into the excess deaths not attributable to COVID-19 and suggested five possible reasons:
- Artefact: deaths directly due to COVID-19 that were not certified as such in the provisional data.
- Unintended consequences (social determinants): deaths are due to unintended consequences of the non-clinical responses to COVID-19.
- Service supply/access: deaths due to problems with health and social care service access.
- Service demand: deaths of individuals not presenting to health and social care services as they would at other times.
- Other: other causes that have not yet been identified.
Characteristics of those whose deaths involved COVID-19
The average age at death for those who died with COVID-19 was 79 for males and 84 for females.
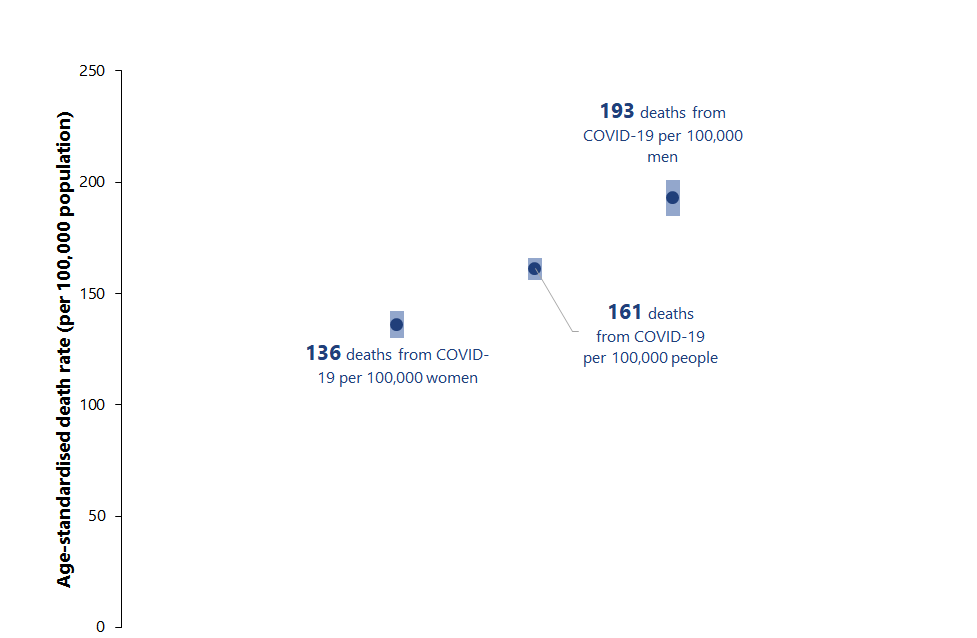
Males were significantly more likely to die with COVID-19 than females once age was taken into account. Although there were broadly similar numbers of deaths of males and females (2,098 males and 2,133 females as of the end of August), comparisons are more helpfully drawn on the age-standardised death rate which shows that for males (193 per 100,000 population) the rate was 42% higher than that for females (136 per 100,000). This is because there are less males in the older age groups so their deaths account for a larger proportion of the male population.
Figure 1.2: Age-standardised death rates from COVID-19 by sex
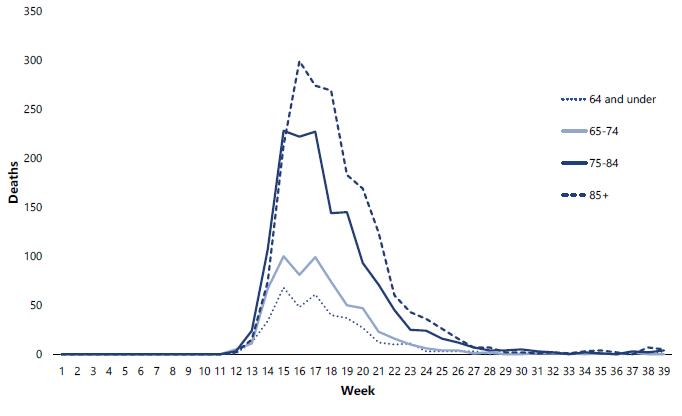
The age profile of those dying with COVID-19 was significantly older than that for deaths in general. More than three quarters (77%) of all those who died were aged 75 or over and 43% were aged 85 or over. Compared to all deaths in 2019, 63% of those who died were aged 75 or over and 33% were aged 85 or over.
In the early weeks of the pandemic most deaths occurred within the 75-84 year old age group but by mid-April most deaths were occurring among 85+ year olds, aligning with the increase in deaths in care homes at this time.
There were very few deaths among those aged under 65 (382, 9% of all deaths) and no deaths under the age of 25.
Figure 1.3: Deaths involving COVID-19 by age-group
What are “process, plant and machine operatives”?
This group covers occupations whose main tasks involve operating and monitoring industrial plant and equipment, assembling products from component parts (i.e. factory workers), and driving and assisting in the operation of transport vehicles and other mobile machinery.
Whilst the numbers of deaths among working people in the 20-64 year old group were proportionately small (233, 6% of all COVID-19 deaths up to the end of August) a broad analysis by occupation group identified that those working as “process, plant and machine operatives” had the highest age-standardised death rate with 25.8 deaths per 100,000 people. This was the only major group which had a significantly different rate to the average rate for all occupations (10.3 per 100,000 people).
In addition to the major occupational groups, an analysis of two specific groups of occupations, health care workers and social care workers, was undertaken using groupings developed by ONS. Given the relatively small numbers involved, death rates for these two groups were not significantly different from the average.
Figure 1.4 shows the age-standardised death rates from COVID-19 for major occupational groups as defined by the ONS Standard Occupational Classification (SOC2010).
Figure 1.4: Age-standardised death rates from COVID-19 for major occupational groups
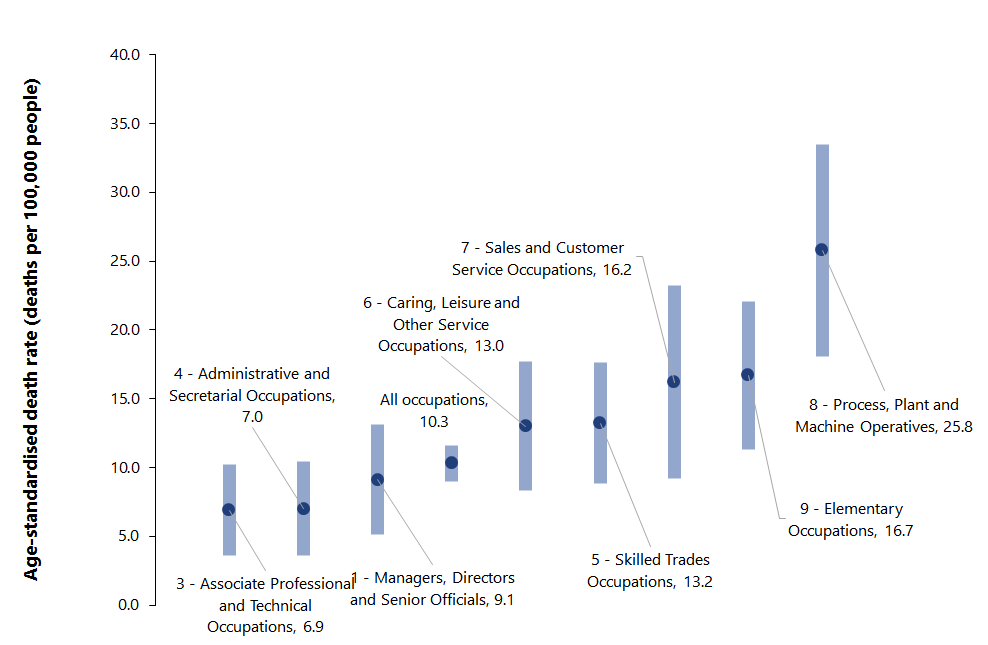
Note: no rates could be calculated for the group “professional occupations” as there were fewer than 10 deaths in this group.
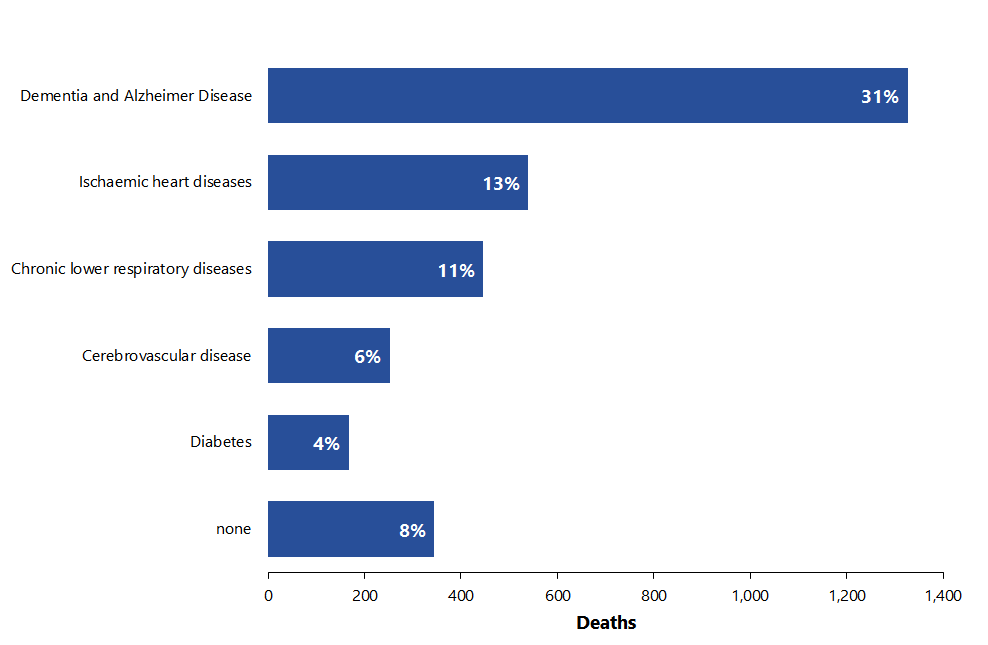
Death certificates of those who died with COVID-19 were also examined to look at their pre-existing conditions. Of all COVID-19 deaths occurring between March and August, only eight per cent had no pre-existing condition.
Of the 92% who did have a pre-existing condition recorded on the death certificate, we looked at the main condition. The most common main pre-existing conditions were:
- Dementia and Alzheimer’s disease (affecting 31% of those who died)
- Ischaemic heart disease (13%)
- Chronic lower respiratory diseases (11%)
- Cerebrovascular disease (stroke) (6%) and
- Diabetes (4%).
What are pre-existing conditions?
Pre-existing conditions are defined as a health condition mentioned on the death certificate which either came before COVID-19 or was an independent contributory factor in the death. Where only COVID-19 was recorded on the death certificate, or only COVID-19 and subsequent conditions caused by COVID-19 were recorded, these deaths are referred to as having no pre-existing conditions.
We have used methodology developed by ONS to determine the main pre-existing condition. This is defined as the one pre-existing condition that is, on average, most likely to be the underlying cause of death for a person of that age and sex had they not died from COVID-19. For more detail on how pre-existing conditions and main pre-existing conditions are derived, refer to the methodology paper.
Figure 1.5: Main Pre-existing condition of people dying with COVID-19, March to August 2020
Ethnic Group and COVID-19
An emerging body of international evidence showed an increased risk of death from COVID-19 for specific ethnic groups. In response, NRS conducted an analysis of the ethnicity data collected through the death registration process. Although the process is statutory, ethnicity information about the deceased person is collected by registrars on a voluntary basis. In May 2020, NRS published a note on the limitations of the ethnicity information collected through the death registration process. Ethnicity was not recorded for 8.9% of deaths involving COVID-19 registered up to 26th April 2020. NRS is continuing to work with registrars to ensure the importance of the data is clear and that all those gathering and providing the data are able to take an informed decision regarding provision, or otherwise, of ethnicity data.
To make analysis by ethnicity possible, death records were linked to 2011 Census records. This allowed census data on self-reported ethnicity to be used, and reduced the number of records with no ethnicity data substantially – from 8.4% to 1.3% for deaths involving COVID-19.
NRS analysis showed that deaths amongst people in the South Asian ethnic group were almost twice as likely to involve COVID-19 as deaths in the White ethnic group, after accounting for age group, sex, area-level deprivation and urban rural classification.
An independent Expert Reference Group on COVID-19 and Ethnicity (ERG) was established to consider and inform the Scottish Government’s approach in relation to the impacts of COVID-19 on Minority Ethnic (ME) communities.
The ERG put forward initial advice and recommendations on several areas, including data and evidence. NRS is happy to be part of the discussions and work to respond to the recommendations of the ERG, including exploring how census data can be used to improve data quality and facilitate timely and responsive analysis of inequalities in health, as set out in the Government’s response to the ERG and reinforced in the Programme for Government.
The use of data for statistical and analytical research is a key component of the public value of gathering data. The Expert Reference Group recommendations have shone a light on areas where important decisions require improved evidence, and NRS will play its full role in helping to improve the quality of relevant datasets.
Where did people die?
In 2019 almost half (48%) of deaths from all causes took place in hospitals, a quarter (24%) in care homes and 28% in home or in non-institutional settings. In the first four weeks of the pandemic (16th March to 12th April 2020) almost two-thirds (62%) of COVID-19 deaths took place in hospitals. However, between 13th April and 14th June the pattern changed as more than half (53%) of COVID-19 deaths occurred in care homes. From mid-June onwards there have been slightly more COVID-19 deaths in hospitals, although the number of deaths was much lower in this period. Over the course of the whole pandemic the proportion of COVID-19 deaths has been similar in both care homes and hospitals (47% in hospitals and 46% in care homes) and only 7% occurring at home or in non-institutional settings.
West Dunbartonshire had the highest age-standardised death rate of all council areas with 314.3 deaths per 100,000 population. This was closely followed by Midlothian (294.3), Glasgow City (291.0) and Inverclyde (280.0). Highland (37.5), Moray (40.4) and Dumfries and Galloway (50.1) had the lowest rates (in addition to Orkney and Shetland whose numbers were too low to calculate rates, and Na h-Eileanan Siar where there were no deaths). After adjusting for age, people in West Dunbartonshire were eight times as likely to die compared to those in Highland.
Figure 1.6: Age-standardised death rates from COVID-19 by local authority
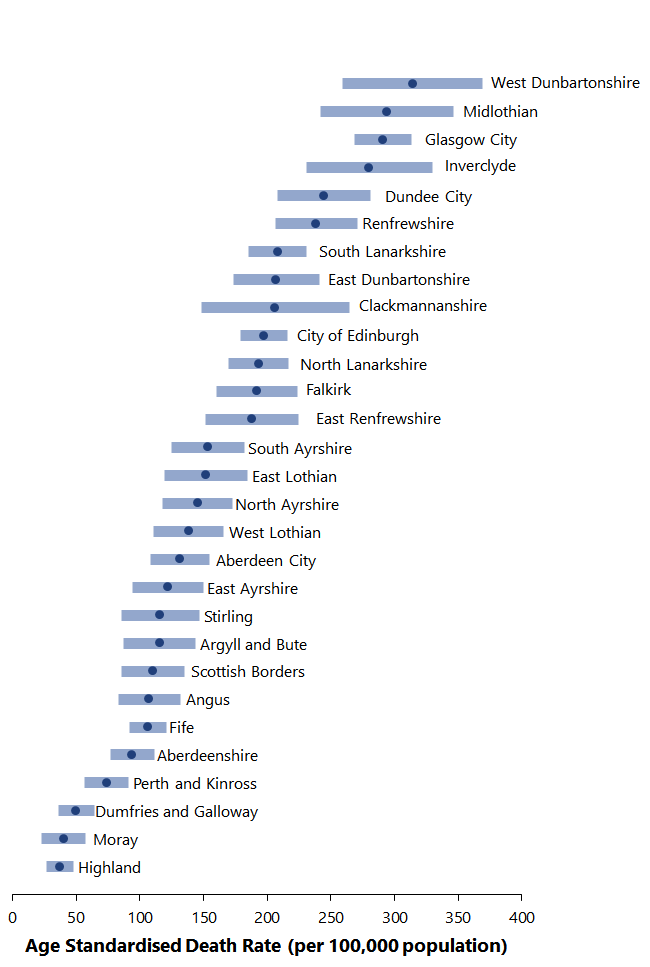
Figure 1.7: Deaths involving COVID-19, Intermediate zones, March to August 2020
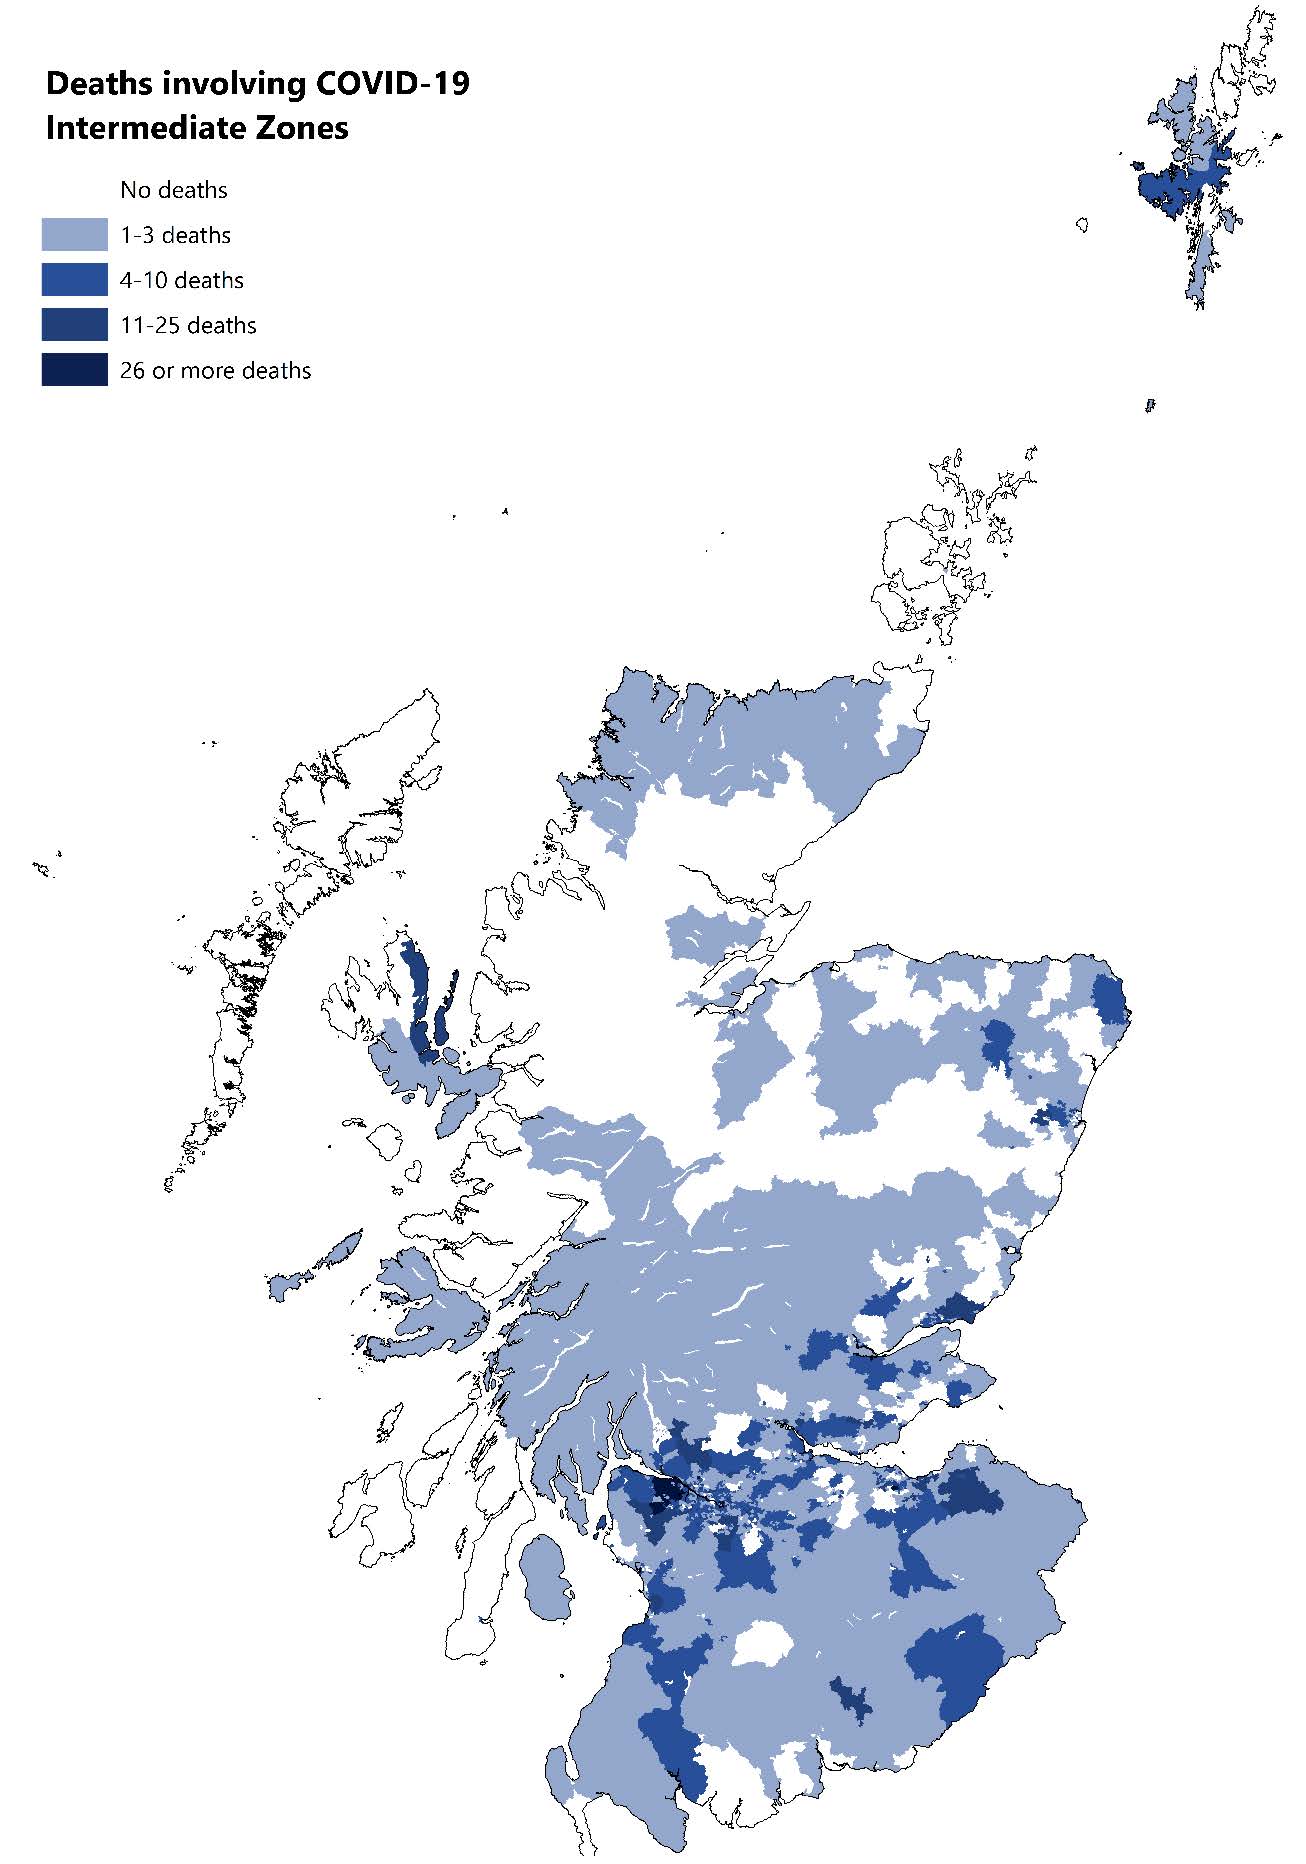
The map in Figure 1.7 details COVID-19 deaths by intermediate zone – a statistical geography that sits between data zones and council areas, in terms of size. There are 1,279 intermediate zones covering the whole of Scotland and their populations range between 2,500 and 6,000.
The darker areas of the map indicate larger numbers of deaths and it is clear that deaths were higher in the more populated urban areas and the central belt with fewer deaths in the rural areas of the highlands and islands.
There was a clear pattern when analysing by areas of multiple deprivation (Figure 1.8). Age-standardised rates in the most deprived quintile (124 per 100,000 population) more than double those in the least deprived quintile (59 per 100,000).
Figure 1.8: Age-standardised death rates from COVID-19 by SIMD Quintile
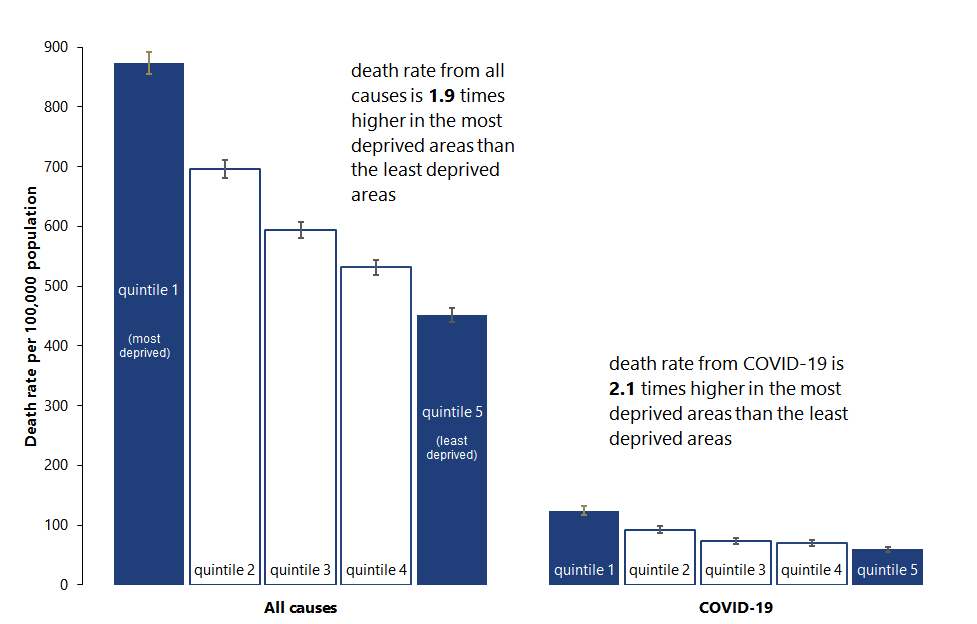
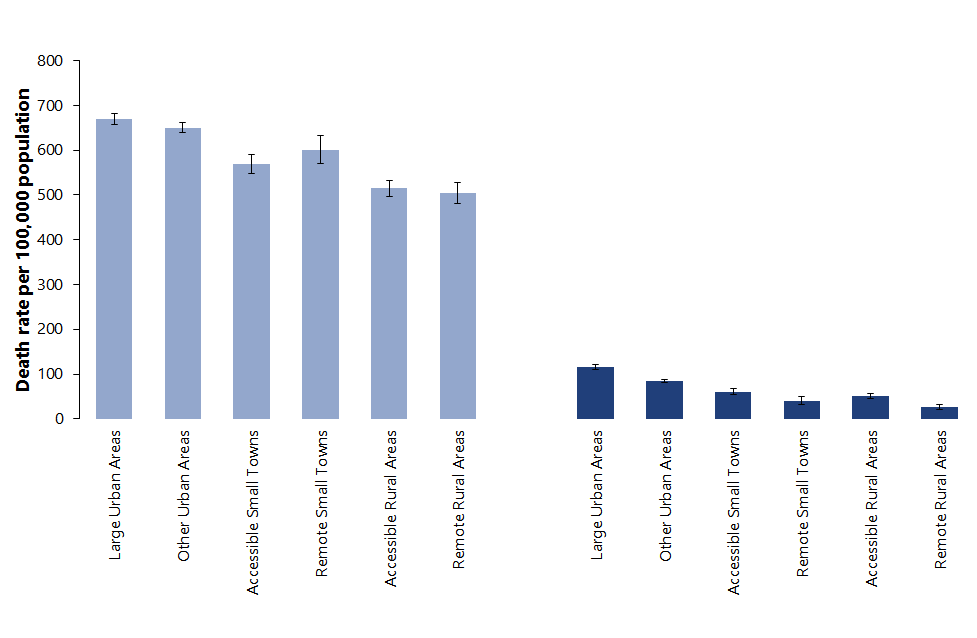
The age-standardised rate for deaths involving COVID-19 in large urban areas (116 deaths per 100,000 population) was over four times that in remote rural locations (27 per 100,000 population). The gap was substantially smaller when considering the rate of deaths from all causes (1.3 times as high in large urban areas compared to remote rural areas).
Figure 1.9: Age-standardised death rates from COVID-19 by Urban Rural classification
Excess Deaths
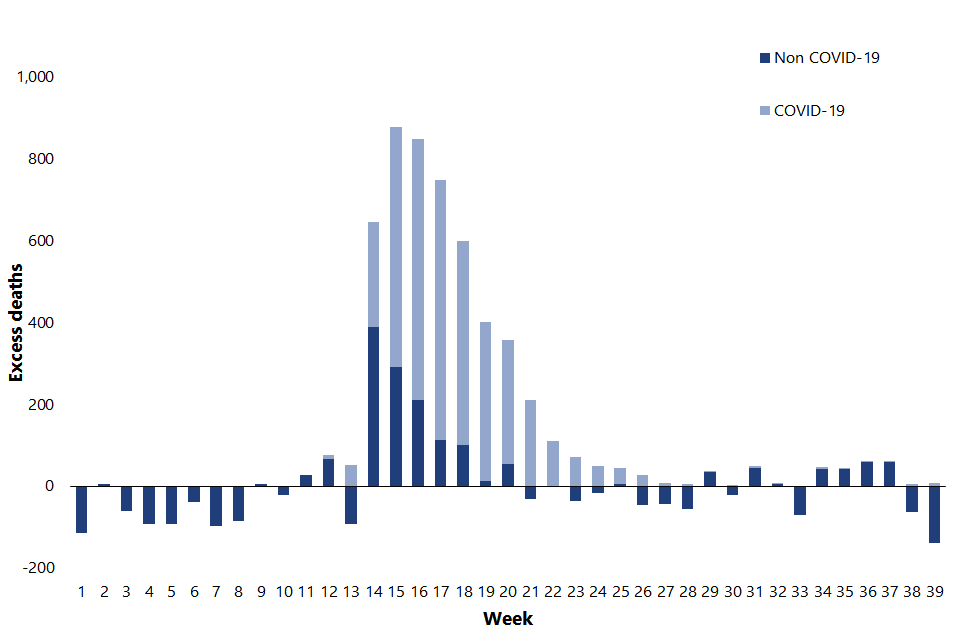
Between January and March 2020 there were 520 fewer deaths compared to the five year average for the same period. This changed dramatically from week 14 (beginning 30th of March) onwards. Excess deaths reached a peak of 858 in week 15 and remained high for several weeks before dropping back to broadly average levels (within +/- 5% of the five year average) from week 23 (beginning 1st of June) onwards. Since week 23, deaths have fluctuated marginally above or below average, suggesting that COVID-19 did not bring forward deaths of people who would have died within a few months from other causes. If that were the case, we would expect to see deaths fall considerably below the five year average.
Figure 1.10: Excess deaths by cause
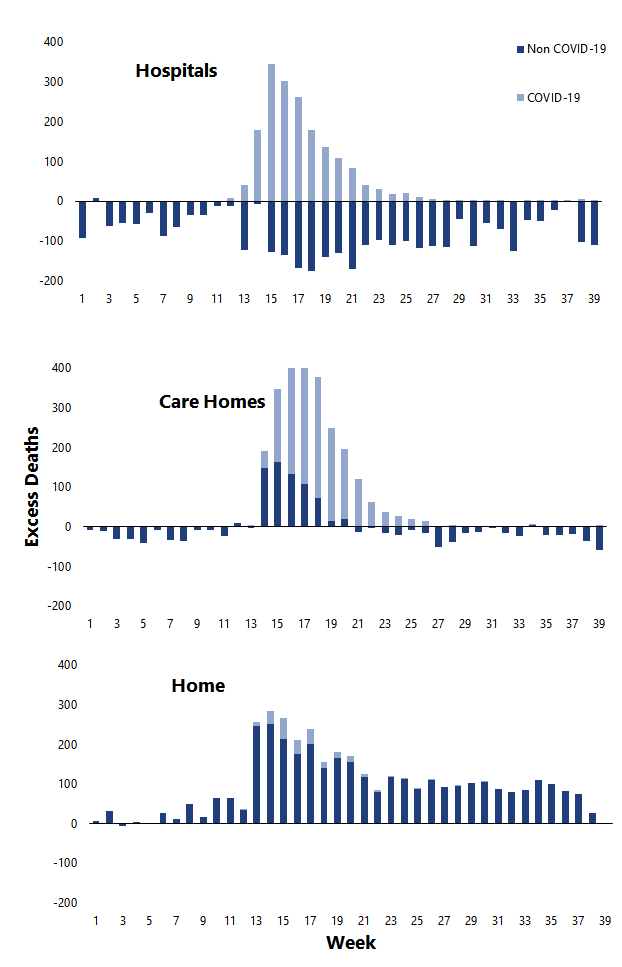
The pattern of excess deaths varied depending on the location of death. An early peak (week 15) in excess hospital deaths was driven entirely by COVID-19 related deaths. Non COVID-19 deaths in hospitals were below average throughout the whole period, leading to overall hospital deaths falling below average from week 19 (beginning 4th of May) onwards.
Conversely, deaths at home or in non-institutional settings have continued to be above average since week 13 (beginning 23rd of March), with very few of them due to COVID-19. This suggests that the measures taken to tackle the pandemic have displaced deaths due to non COVID-19 causes (i.e. cancer, heart disease etc.) from hospitals into home settings.
Excess deaths in care homes peaked slightly later than in hospitals (week 17, beginning 20th of April) and also took longer to return to average levels (week 24, beginning 8th of June). The majority of excess deaths in care homes were COVID-19 related although there were notable numbers of non-COVID deaths in the early weeks. This may be partly due to undiagnosed COVID-19 at a time when testing was less prevalent
Figure 1.11: Excess deaths by cause and location
Further detail on excess deaths by specific causes of death is available in our monthly publication “Deaths involving coronavirus (COVID-19) in Scotland”.
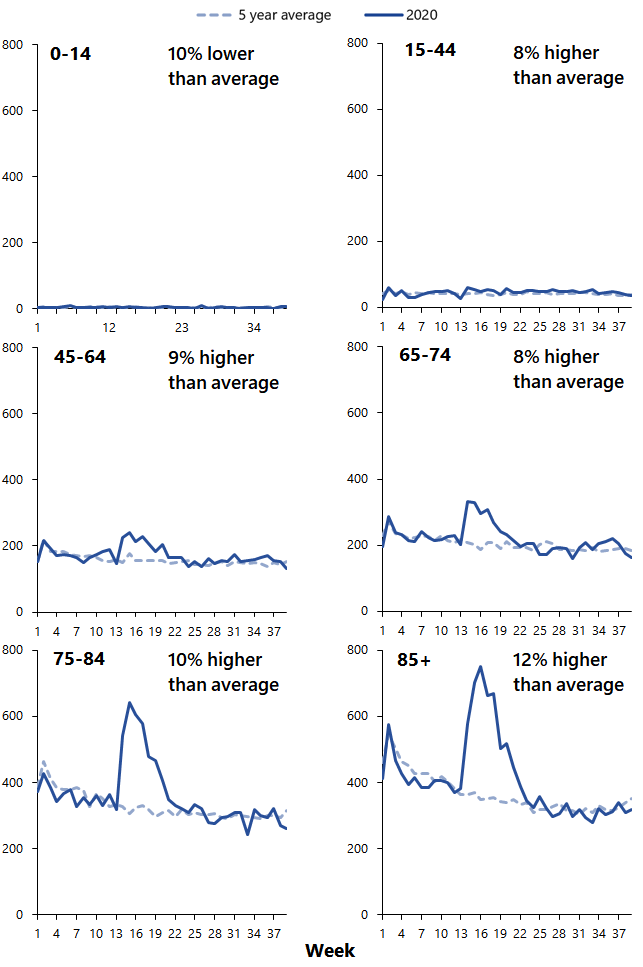
The majority of excess deaths occurred in the oldest age groups with the greatest excesses seen among the 75-84 years and 85 and over age groups. There were no excess deaths among children and very few among 15-44 year olds. The number of excess deaths among 45-64 year olds and 65-74 year olds was relatively low in comparison with the oldest groups but there were still notable excesses compared to the average number of deaths from all causes for these age groups.
Figure 1.12: Excess deaths by age
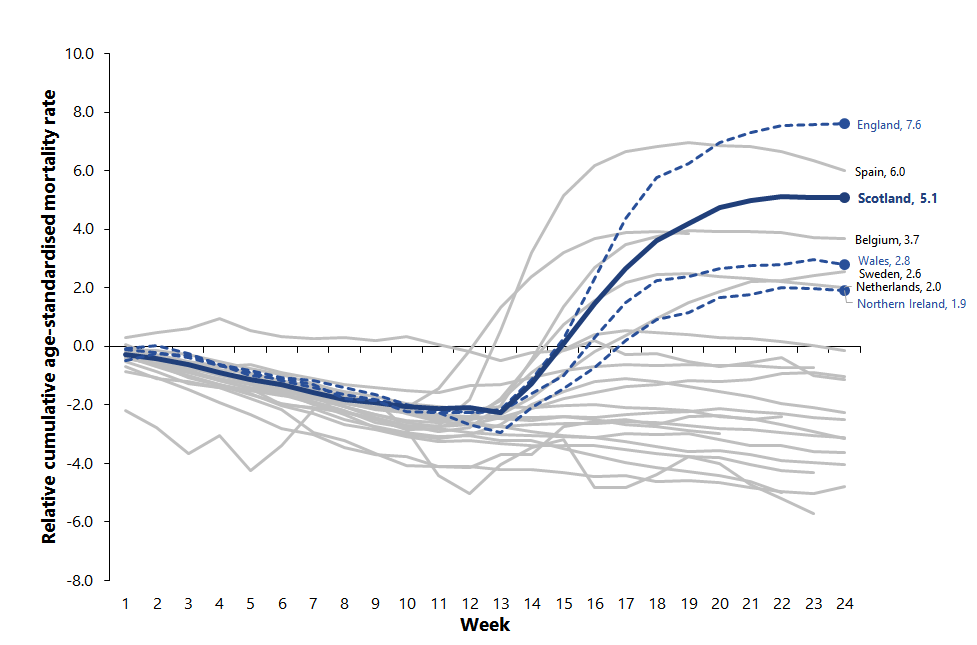
How does Scotland compare with other countries?
ONS published analysis comparing excess mortality rates between European countries covering the period from January to mid-June 2020. The analysis found that Scotland had the third highest excess mortality rate in Europe, behind England and Spain.
This measure takes into account the fact that countries have different sizes of populations, and different age structures. By week 24, Scotland’s age-standardised mortality rate for the year to date was 5.1% higher than the five year average. Spain was 6.0% above average and mortality in England was 7.6% higher than the five year average.
Comparing excess deaths rather than COVID-19 deaths avoids the problem of different countries recording COVID-19 deaths in different ways, and it also takes into account the indirect impact of the pandemic, such as deaths from other causes that might be related to delayed access to health care.
Figure 1.13: Relative cumulative age standardised mortality rates, selected European countries