Introduction
As highlighted in the demographic overview in Chapter 1, the main reason for Scotland’s falling population in recent years has been the decline in the number of births. This chapter briefly describes trends in births during the twentieth century before focusing on changes over the more recent period. Some limited comparisons with other parts of the United Kingdom and selected other countries are also presented. The chapter concludes with a consideration of official birth projections and the effect of these on population projections. Discussion of the possible reasons for the current low levels of fertility, and the demographic and policy implications of the current trends, is left to Chapter 3.
Trends during the twentieth century
Numbers
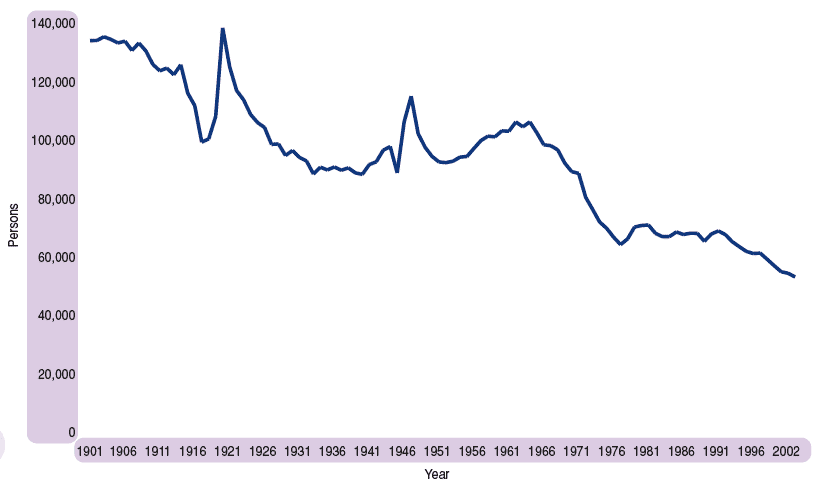
Figure 2.1 shows the annual number of births in Scotland for the last 100 years. Apart from peaks after each of the World Wars, births have generally been in decline since the start of the twentieth century. However, as in many other western countries, there was a substantial increase in the number of births during the second half of the 1950s, with a peak in the mid-1960s (at 104,000), followed by marked decline in the late 1960s and early 1970s. Following a small recovery, the numbers stabilised between 60,000-70,000 during the 1980s before resuming the decline in recent years. At 51,270, the total number of births registered in 2002 was the lowest number since civil registration began in 1855. Moreover, the 2002 total is only half that recorded in the mid-1960s and represents a fall of over a fifth in the last decade.
Figure 2.1 Live births, Scotland, 1901-2002
Fertility rates
Crude birth rate
The simplest fertility rate is the so-called ‘crude birth rate’ which is defined as the number of live births per 1,000 total population. Appendix Table 1 shows that in 2002 the crude birth rate for Scotland stood at 10.1 compared with around 20 fifty years ago and around 30 a hundred years ago. Because it takes no account of the age/sex structure of the population, the crude birth rate has only limited value, e.g. for giving rough comparisons between areas with broadly similar age/sex structures. Appendix Tables 2 and 3 present crude birth rates for, respectively, administrative areas in Scotland and selected European and other countries. Appendix Table 2 also gives standardised birth rates for the administrative areas of Scotland – these adjusted birth rates take account of the population structures in the different areas.
General fertility rate (GFR)
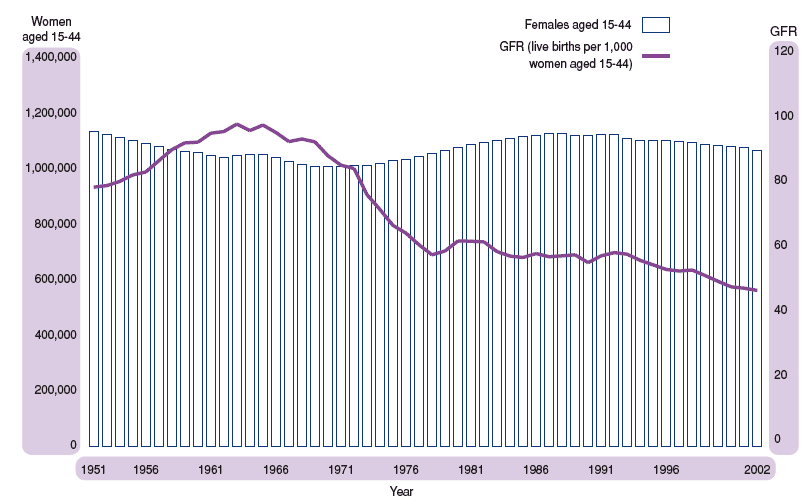
A better approach is to consider rates based on the numbers of women of childbearing age. Figure 2.2 shows the general fertility rate (births per 1,000 females aged 15-44), along with the number of women aged 15-44, since 1951. During the 1960s baby boom the GFR reached 99.5 (in 1962). It then fell sharply to around 60 during the 1980s before declining further during the 1990s to a value of 48.1 in 2002. Interestingly, the chart shows that the female population aged 15-44 was relatively low during the baby boom of the 1960s. Moreover, the levelling off in the annual numbers of births during the 1980s was in part associated with the increasing numbers of women born in the 1950s and 1960s, passing through their childbearing years.
Figure 2.2 Estimated female population aged 15-44 and general fertility rate (GFR), Scotland, 1951-2002
Age-specific fertility rates
A more detailed picture may be obtained by calculating fertility rates for narrower age bands. Figure 2.3 presents rates by mother’s age in five-year age groups. This chart shows many significant age-related features of the pattern of childbearing over the last fifty years. The key point to emerge is that as well as choosing to have fewer babies, women are also choosing to have them later in life. More specific points include:
i. The 1960’s baby boom was mostly due to increased birth rates of women in their 20s.
ii. Over the last 35 to 40 years birth rates for women in their 20s have experienced a dramatic fall. For women aged 20-24 the fertility rate has fallen by 70 per cent; and for those aged 25-29 it has fallen by 60 per cent.
iii. Fertility rates for women aged 30 and above have gradually increased over the last 25 years; in particular, the rate for 30-34 year olds overtook that of 25-29 year olds in 2002.
iv. Despite the recent increases, rates for women aged over 30 are still well below the equivalent rates seen in the 1950s and 1960s.
v. Though falling by around one-third during the early 1970s, the rate for 15-19 year olds has shown only a modest decline thereafter.
Figure 2.3 Live births per 1,000 women, by age of mother, Scotland, 1951-2002
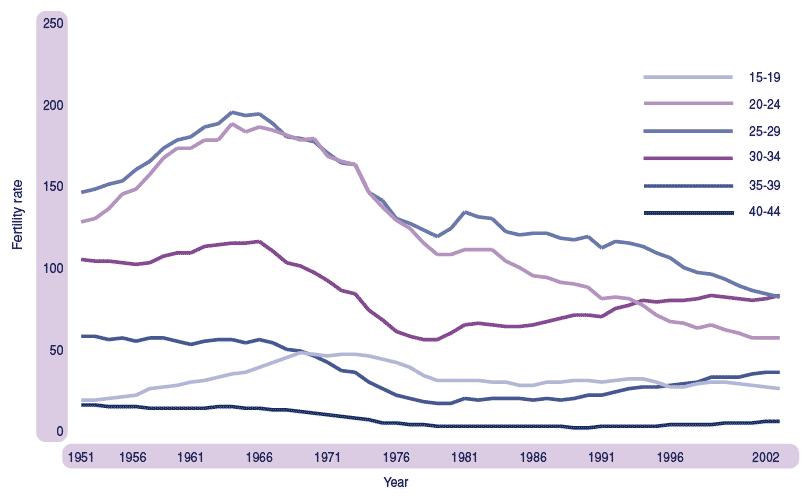
Figure 2.4 further illustrates the ageing pattern of fertility by showing detailed age-specific fertility rates for selected years of the post-war period: 1951, 1964, 1977, 1991 and 2002. Even though the levels differed considerably, the overall age patterns of fertility for 1951, 1964 and 1977 were roughly the same. However, the age distribution for 1991 shows a distinctly older peak; and that for 2002 reveals the collapse of fertility amongst women in their 20s.
Figure 2.4 Live births per 1,000 women, by age, selected years
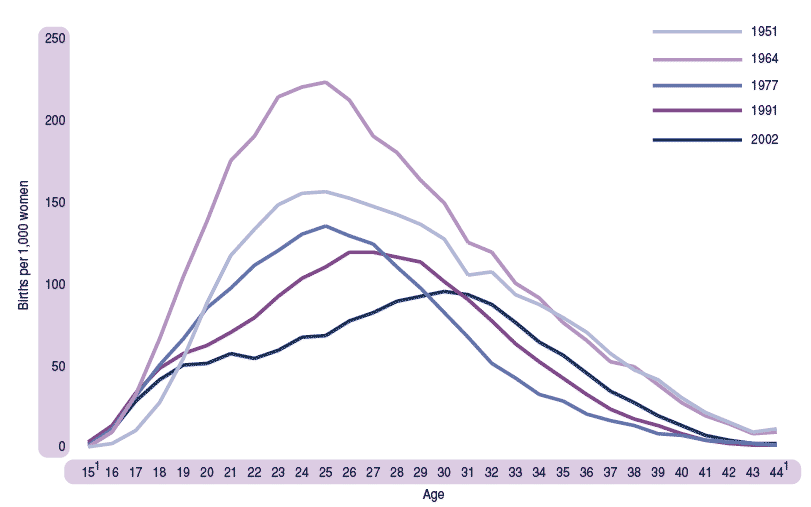
1 R ate for age 15 includes births at younger ages and for age 44 includes births at older ages.
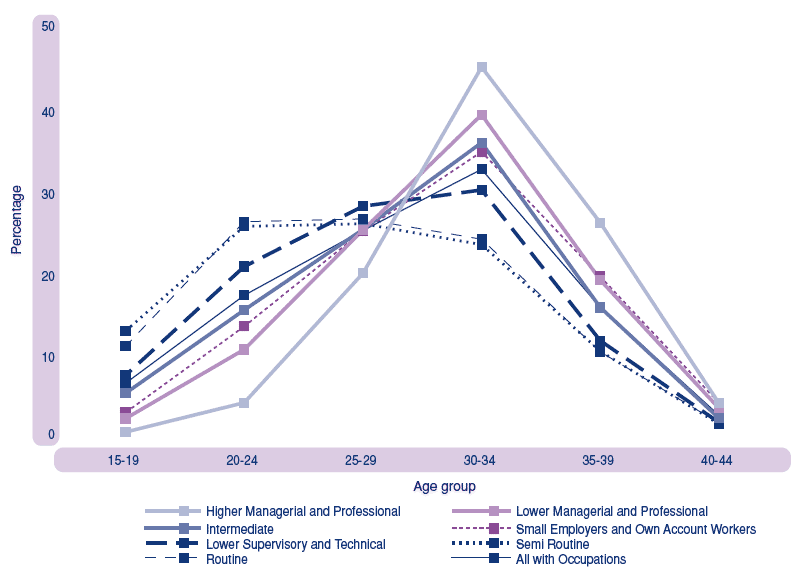
Figure 2.5 shows how the age profile of mothers in 2002 varied significantly by socioeconomic class (as defined by occupation). For those allocated to ‘managerial and professional’ categories there was a particularly marked peak of childbearing in the 30-34 age group. By comparison, the peak childbearing ages for those in ‘routine’ and ‘semiroutine’ categories were 20-29. The other socio-economic categories all displayed a less marked peak in the 30-34 age group.
Figure 2.5 Percentage of births by age group, by NS Socio-economic Class, Scotland, 2002
Average age of mother
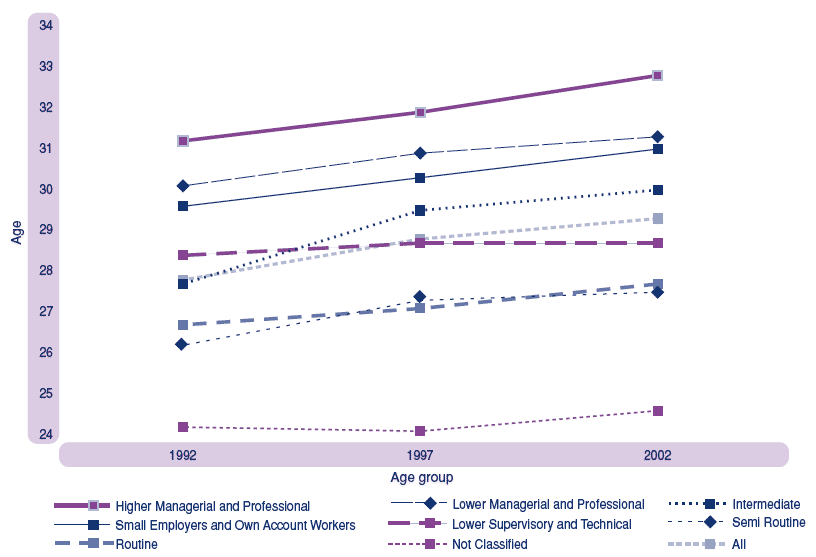
The trend towards later childbearing may be summarised by considering the average age for all mothers. In 2002, the average was 29.2 compared with 27.4 in 1991, 26.1 in 1977, and 27.4 in 1964. Figure 2.6 shows that over the last ten years the average age of mothers increased by broadly similar amounts for all socio-economic classes. In 2002, the average age ranged from just under 28 for those in the ‘routine’ and ‘semi-routine’ categories to just under 33 for the ‘higher managerial and professional’ category.
Figure 2.6 Average age of mother, by NS Socio-economic Class, Scotland, 1992-2002
Total Fertility Rate
The total fertility rate (TFR) is a commonly used summary measure of fertility levels calculated by summing each of the age-specific rates for a single year. It may be thought of as the average number of children that a group of woman would expect to have if they experienced the age-specific fertility rates (ASFRs) observed in the given year throughout their childbearing years.
The TFR for Scotland since 1951 is plotted in Figure 2.7. Not suprisingly, it follows the same general pattern as the GFR described earlier. It rose to 3.09 in 1964 before dropping sharply to 1.70 in 1977 since when, with a few minor fluctuations, it has fallen more slowly to its current (2002) level of 1.48.
Figure 2.7 Total fertility rate, Scotland, 1951-2002
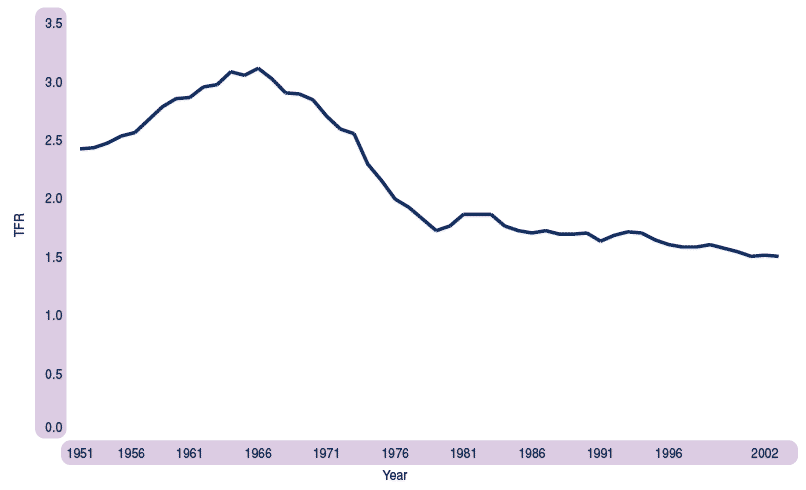
Though widely used, in part because it is relatively easy to calculate, the TFR has serious deficiencies as it is based on only one year’s observations. For example, when women are delaying childbearing the TFR is likely to underestimate the number of children women will eventually have; and if women are having children earlier, the TFR will probably overestimate the long-term average number of children. However, as discussed earlier it is the former scenario – delayed childbearing – that is prevalent in Scotland at the present time.
Completed family size
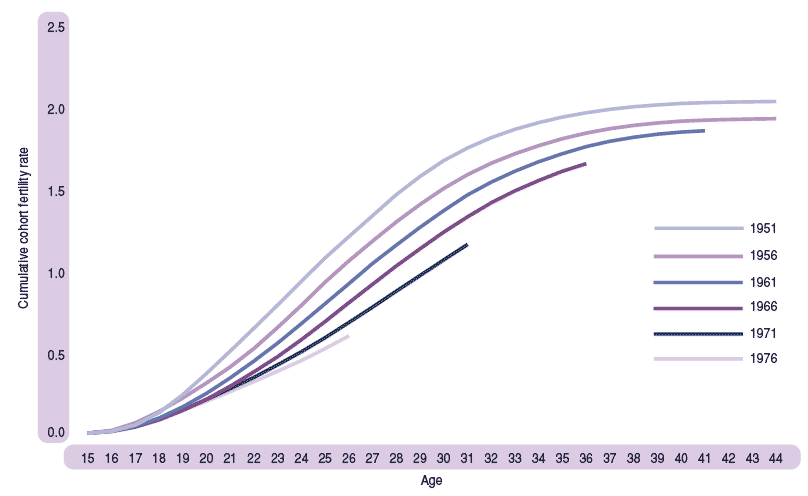
A more satisfactory measure is average completed family size. Conventionally this is calculated by summing over time the succeeding ASFRs of women born in a particular year. (Such an approximation assumes that the effects of mortality and migration are negligible.) Though more intuitive, this measure itself has a fundamental drawback – namely that one can only calculate a value for women who have reached the end of the main childbearing ages, say at 45 years of age. Nevertheless there is real value in considering the historical data for cohorts that have reached this age and the partial series for those not yet 45.
Figure 2.8 shows the completed family size (or cumulative cohort fertility) by age for women born in selected years. Those born in 1951 had attained an average completed family size of 2.03 by the time they reached 45 whereas for those born in 1956 the figure was 1.93. The chart also permits the comparison of family size at selected ages for the various cohorts as they pass through the childbearing ages. For example, by age 30, the cumulative childbearing of the 1971 cohort is about 0.6 lower than that of the 1951 cohort. Of crucial importance is the extent to which the later cohorts are falling behind in family building. The replacement level at which families reproduce themselves is about 2.1 children. Whilst the increasing fertility rates of those aged over 30 may lead to some catching-up, it seems highly unlikely that this will increase the average completed family size to the levels attained recently by the 1950’s cohorts.
Figure 2.8 Cumulative cohort fertility rate for selected birth cohorts, Scotland
Regional variation
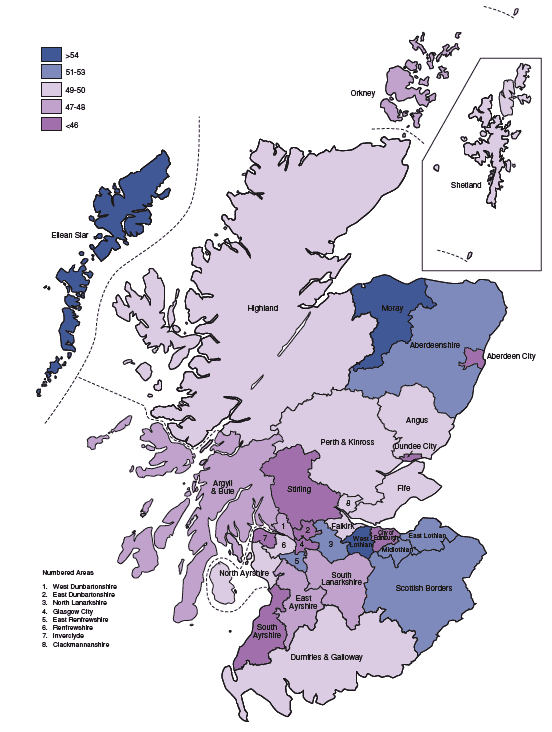
The trend of declining births experienced at the Scotland level is also evident for areas within Scotland, but fertility levels are not uniform across the country. Figure 2.9 shows the 2002 GFRs for Council areas. Compared with a Scottish rate of 48.1 births for every 1,000 females of childbearing age, urban areas tend to have a lower birth rate than the Scottish average, e.g. at 41.3 the rate for Edinburgh is 14 per cent below the Scottish average. The reasons for this are complex but the following factors are thought to be important – large student populations, high female economic activity rates and the higher costs of housing.
There is evidence that the urban hinterlands and the more rural areas, e.g. Midlothian, East Lothian, West Lothian and Aberdeenshire, tend to have higher rates of fertility. This may be associated with the availability of affordable family housing and lower female economic activity rates. There may also be more specific reasons, e.g. the relatively high GFR in Moray will, at least in part, be due to the large numbers of young families associated with the Armed Forces.
Figure 2.9 Live births per 1,000 women aged 15-44, by Council area, 2002
Comparisons with the rest of the UK and other western countries
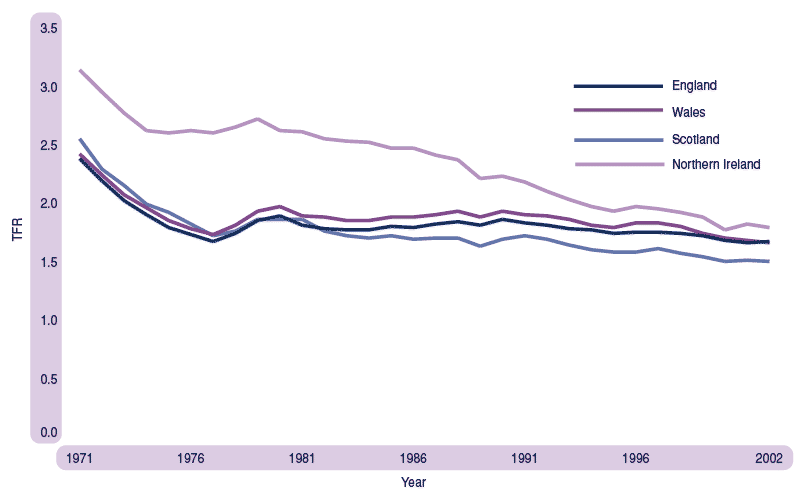
Scotland’s fertility has not only been falling in recent years relative to past levels, it has also been falling relative to fertility in other parts of the United Kingdom. Figure 2.10 compares the TFRs for England, Wales, and Northern Ireland with those for Scotland since 1971. Until the late 1970s Scotland’s TFR was slightly higher than those for England and Wales but since the early 1980s, Scotland’s TFR has dropped steadily below the levels for England and Wales. In 1971 the TFR for Northern Ireland was markedly higher than for the other three countries. However, over the last 30 years the differential has been significantly reduced.
Figure 2.10 Total fertility rates, UK countries, 1971-2002
A comparison of the latest TFRs available for Scotland and countries of the European Union is shown in Figure 2.11. Scotland’s TFR in 2001 was 1.49, just above the EU average (1.47). Italy (1.24) and Spain (1.25) currently have the lowest TFRs in the EU; and France (1.90) and Ireland (1.98) have the highest.
Figure 2.11 Total fertility rates, selected countries, 2001
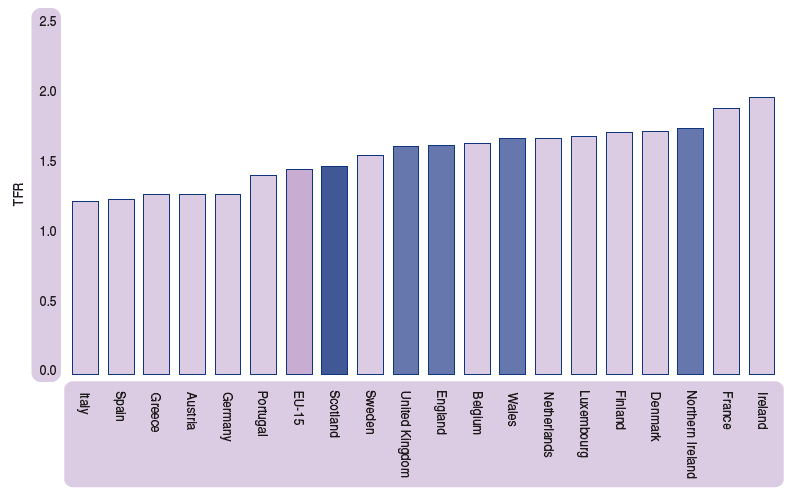
Source: ONS and Eurostat
Birth projections
Official population projections for Scotland are prepared on a regular basis by the Government Actuary’s Department (GAD). The projections are prepared using a component projection model in which fertility projections have a key role. Because cohort rates are more stable than those for calendar years, the fertility rates used in the projections are derived from assumptions relating to the long-term average completed family size of successive cohorts of women. These assumptions are based on family building patterns to date and other relevant evidence. For the most recent, 2001-based, principal projection GAD assumed that the average completed family size for Scotland would decline from its current level of around 1.95 for women born in 1955 to 1.6 for women born in 1990 and later. Figure 1.6 shows the resultant birth projections from 2001 until 2026. As can be seen, after a slight fall these remain relatively stable at around 50,000 until 2019-20. However, by 2025-26 the number of births is projected to fall to around 47,000.
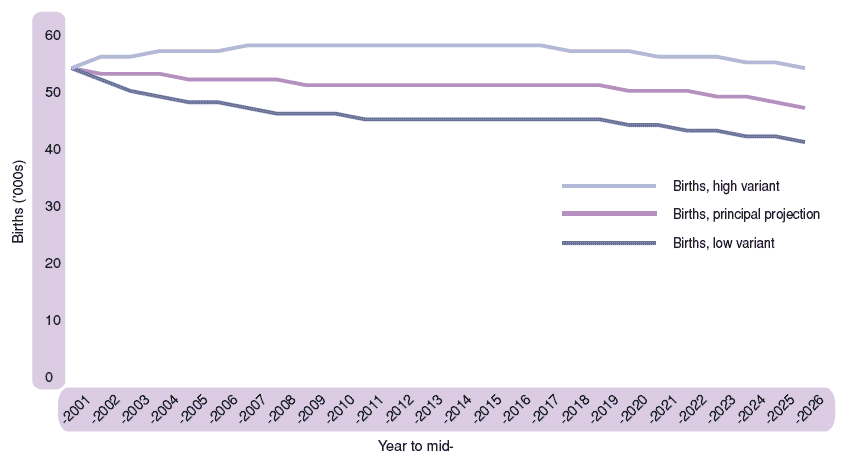
For the previous 2000-based projections GAD prepared high and low fertility variants using assumed long-term average completed family sizes of 1.8 and 1.4 respectively. The projected births, together with those used in the principal 2000-based projection are shown in Figure 2.12. By 2025-26 the annual total of births ranges from 53,000 for the high fertility variant, through 46,000 for the principal projection, to 40,000 for the low fertility variant. The effect of these two variants on the projected mid-2026 population would, respectively, be an increase of some 148,000 or a decrease of some 136,000 compared with the principal projection.
Figure 2.12 Birth projections, Scotland, 2000-2026
Source: GAD