MIGRATION OVERVIEW
Trends in migration since 1951
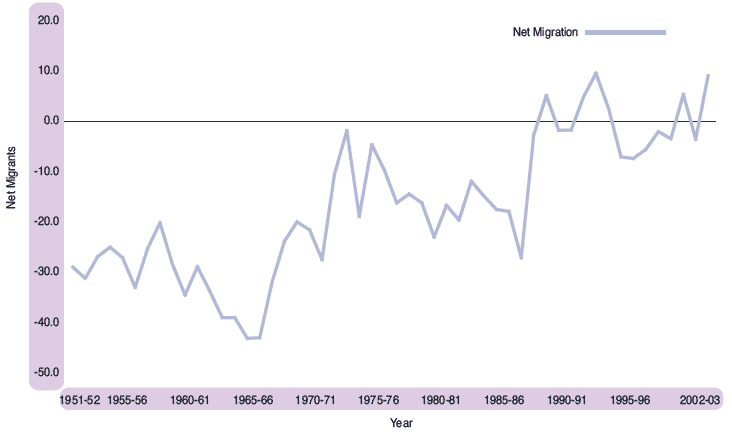
Historically, Scotland has been a country of net out-migration rather than net in-migration – that is more people leave Scotland to live elsewhere than move to live in Scotland. However, since the 1960s net out-migration has reduced significantly and in recent years has been less than half of the peak net migration losses experienced in the 1960s. Indeed, in six out of the last fourteen years, Scotland experienced net migration gain rather than loss. There has been an underlying long-term trend of decreasing net emigration from Scotland over the last 50 years, as can be seen from Figure 2.1.
Net migration is the difference between much larger gross flows of migrants into and out of Scotland. In the last 10 years these have typically been of the order of 70,000 both in and out of Scotland. The level of net migration can be significantly affected by relatively small changes in these gross flows from year to year, particularly if one flow rises while the other falls.
Figure 2.1 Estimated net migration, Scotland, 1951-2003

The age and sex of migrants
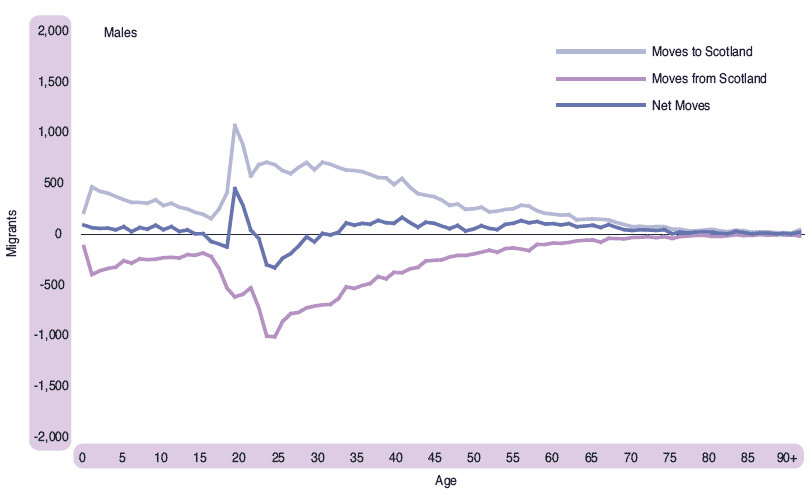
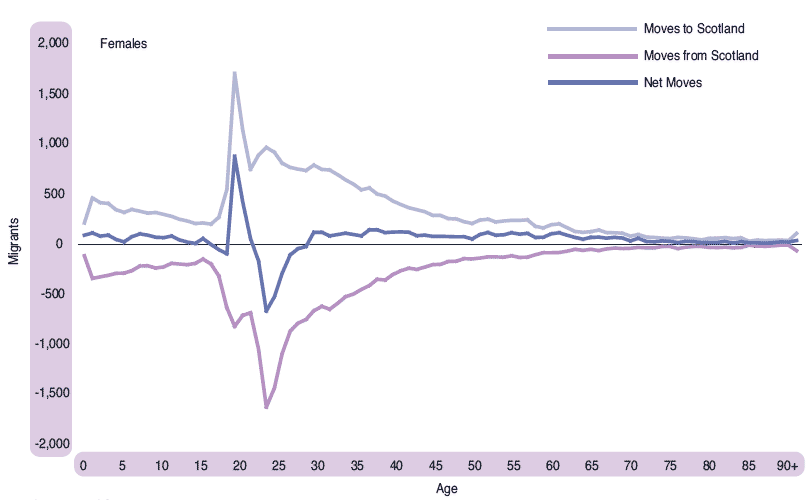
The age/sex pattern of migrants tends to remain relatively constant from year to year. Figure 2.2 illustrates the age/sex distribution of exchanges of migrants with the rest of the UK between 2002 and 2003. The peak ages for migrating are the late teens to mid-20s reflecting moves out of the parental home to attend higher education or take up employment. There also tend to be smaller peaks for moves of the very young, under the age of five. This reflects migration of parents who move home before their children have started school. The pattern of migration is very similar for men and women though women tend to have much larger peaks in their early 20s than men. However, this may reflect different patterns of re-registering with an NHS doctor after a move (the main data source for migration estimates) rather than different patterns of migration. This issue is explored further in the section on Migration Data Sources.
Figure 2.2 Movements between Scotland and the rest of the UK, by age, mid 2002–mid 2003
Source: NHSCR
The peaks in migration for males and females in their late teens and early twenties create marked net migration gains at ages 19 and 20, and net migration losses at ages 23 and 24. These patterns are consistent with an influx of students from the rest of the UK and overseas starting higher education, followed by a further move after graduation.
Migration – revisions to the 1982–2000 Series
The results of the 2001 Census indicated that the previously published 2000 mid-year estimates had been overestimated by some 50,000 as a result of cumulative errors in estimating migration (mostly by young men) during the 1980s and 1990s. As a result, the migration estimates for 1982-2000 have been revised. It is likely that these migration errors are the result of an underestimation of young male migration from Scotland to the rest of the world during this period, but if moves from Scotland to the rest of the UK have been under-recorded, as suggested below the implied increase in overseas migration would be less.
To ensure that migration estimates do not continue to be overestimated, an adjustment has been included in the 2003 mid-year estimates. The estimated civilian migration component includes an adjustment for unmeasured migration. At the Scotland level, this adjustment amounts to an outflow of 2,600.
Further work is being undertaken to review the quality of the method and data sources used to estimate migration, in particular to reduce the level of unmeasured migration. Following this work it will be possible to provide estimates of flows between Scotland and the rest of the UK, and with overseas consistent with the revised population estimates. This work is outlined later in this chapter.
More information on the cumulative migration error since 1981 can be found in the GROS Paper Comparisons with Previous Estimates and Implications for Revisions on the GROS website or by contacting GROS Customer Services.
MIGRATION DATA SOURCES
Migration is the most difficult component of population change to estimate. The other components (births and deaths) are estimated using data from the civil registration system, which is considered to be virtually complete. In contrast, there is no comprehensive system which registers migration in the UK – either moves to or from the rest of the world, or moves within the UK. Estimates of migration therefore have to be based on survey data and the best proxy data that exist.
Sources of data for estimating migration
Migration is derived from three key sources of data. The National Health Service Central Register (NHSCR) is used to calculate moves between health board areas within the UK, with migration at council area level within Scotland estimated using anonymised data from the Community Health Index (CHI). The International Passenger Survey (IPS) provides information on moves into and out of Scotland from outside the UK.
The NHSCR system records the movements of patients between NHS health board areas in the UK. Each time a patient transfers to a new NHS doctor in a different health board area, the NHSCR is notified and these patients are considered to have made a migrant move. Counts of these re-registrations are used as a proxy indicator for moves within the UK.
The CHI holds records of people registered with an NHS doctor in Scotland. Unlike the NHSCR, the records provided to GROS contain the postcode of the patient's address, which enables migration to be estimated at council level, and potentially for smaller areas. The approach used for estimating council-level migration involves matching CHI patient records which are extracted from a database which reflects the ‘live’ CHI system on two occasions one year apart.
This matching of two extracts, say A and B, will create three sets of patients:
The set of patients in both extracts whose postcodes were not the same in each extract can be considered as those within-Scotland migrants who moved from one address in Scotland to another within Scotland between the dates of the two extracts. The remaining two sets of patients are either migrants to or from Scotland; babies born between the two extracts; deaths between the dates of the two extracts; movements to or from the Armed Forces; and a small number of records that are for the same patient but have different CHI numbers because they could not be matched when the GP registration was processed.
Currently, GROS migration data derived from the NHSCR is considered to be the most reliable data available at health board level, so estimates from the CHI are controlled to ensure that they are consistent with the NHSCR data for moves across a health board boundary by origin, destination, age and sex.
The International Passenger Survey (IPS) is a continuous sample survey conducted by the Office for National Statistics at the principal air, sea and Channel Tunnel routes between the UK and countries outside the British Isles. The sample of migrants contacted within the survey is small, particularly for Scottish migrants (approx 120 survey contacts during 2002), and therefore estimates derived from the IPS are subject to larger sampling and non-sampling errors, and are considered less reliable than UK-level estimates. Information about the country of origin and destination, and age of migrants is particularly subject to error. In addition to IPS data, additional information is received on migrants to and from the Republic of Ireland, asylum seekers and visitor switchers.1
Scottish Enterprise have recently commissioned research which aims to develop models which describe the causes of migration flows to and from Scotland. This work will also scrutinise the evidence base for migration research, and provide useful input into the process of reviewing the methodology for estimating migration flows in future.
International migration
Under National Statistics arrangements there is a commitment to carrying out a programme of thorough reviews of key outputs, at least every five years. A quality review of International Migration was recently undertaken and the final report published in September 2003. (http://www.statistics.gov.uk/)
The review’s scope included all forms of migration between the UK and the rest of the world. National Statistics outputs covered by the review included both statistics relating to all migrants, and statistics relating only to those non-citizen migrants who are subject to UK immigration control. Geographical and legal aspects of migration were covered, including for immigrants, their countries of origin, routes of entry and UK destination, and for emigrants, place of last UK residence, citizenship, legal residence status and duration of stay in the UK. Also in the review’s scope were demographic, social and economic characteristics of migrants.
The review highlighted opportunities to develop and make better use of existing sources, and to develop and prepare for the exploitation of potential new sources. The review made nineteen recommendations in the broad areas of:
An implementation plan for the quality review was published in January 2004 (http://www.statistics.gov.uk/methods_quality/quality_review/downloads/final_implementation_plan_nsqronim.doc), and since then there have been a number of improvements made to the design of the IPS, including the addition of questions on intentions. There are also plans to extend fieldwork hours, to conduct a port survey of emigrants and to carry out research into non-responders to the IPS. Research is also underway comparing the distribution of immigrants in a number of sources. This should result in a new methodology being agreed in time to be implemented into the 2004 mid-year estimates.
Estimates of total international migration into Scotland are published by the Office for National Statistics (ONS). The ONS estimates use a consistent methodology based primarily on the IPS to allocate migration to Scotland. The methodology is currently under review as part of the quality review, and in the meantime, a slightly different methodology is used for the purposes of population estimates in Scotland.
Possible underestimate of migrating young men
Previous research carried out by the Office for National Statistics (ONS) has shown estimates for internal migration among females to be higher than for males in the student and other young adult age ranges. Work has been conducted to establish whether this discrepancy is attributable to: more females in these age ranges migrating than males of the same ages; and/or the two sources of data used to estimate internal migration – the NHSCR and patient register data2 not fully capturing young male migration.
Comparisons with the 2001 Census migration data confirm that internal migration is underestimated amongst males aged 16-36 in the two sources of data used to estimate internal migration. However, as there is no suitable data source from which to revise estimates, no adjustment or revisions will be made currently to the internal migration estimates of young males.
Preliminary work in Scotland looking at both migration internal to Scotland and with the rest of the UK, suggests that the issue also exists here in that there are proportionately more female migrants than males at young ages in the NHSCR sources compared with the Census. As part of the work in Scotland to review migration sources, this will be investigated further in collaboration with ONS, in order to identify the scale and impact of any such undercount. In the meantime, the adjustment for migration error will take account of this undercount in Scotland.
Availability of migration data
Information on migration is available on request through GROS Customer Services (address on page 76). The outputs in the following table are available routinely. Other more detailed breakdowns can be made available on request, although the degree of detail may have to be limited subject to confidentiality constraints. In the next year, we hope to expand our list of routine outputs available via the website to include council area level migration in particular.
Topic |
Period |
Source |
|---|---|---|
Internal migration flows by constituent countries of the UK and Government Office Regions of England |
Annual and quarterly |
Population Trends, 116 (The Stationery Office, 2004) Table 8.1 |
Internal migration from Scotland to England, Wales and Northern Ireland |
Mid-year (year ending June) |
Key population and Vital Statistics: Local and Health Authority Areas, 2002 (Series VS no. 29, PP1 no. 25, The Stationery Office, 2004) Table 5.3a and 5.3b. |
Internal migration between Health board areas in Scotland, the rest of the UK and movements in and out of the armed forces |
Annual or mid-year |
On request from GROS |
Internal migration into and out of each health board area by sex and 5 year age band |
Annual or mid-year |
On request from GROS |
International migration flows |
Annual |
International migration, 2002 (Series MN no. 29. The Stationery Office, 2004) Table 2.8 |
Overall Net migration |
Mid-year |
International migration, 2002 (Series MN no. 29, The Stationery Office, 2004) Table 1.1 |
THE 2001 CENSUS OF POPULATION
This section summarises information about migration from the 2001 Census of Population.
The Census in Scotland asks people to give their usual address one year before the Census. This provides information about migrants within Scotland and to Scotland from the rest of the UK and from the rest of the world. The Census returns for England, Wales and Northern Ireland allow us to identify migrants from Scotland to the rest of the UK. But the UK Censuses cannot provide any information about migrants from Scotland to places outwith the UK.
Numbers of migrants
Table 2.1 shows these migration flows. Almost 12 per cent of the Scottish Census population had moved in the year before the Census. But most (7 per cent) stayed in the same council area. The number of people who moved from England, Wales or Northern Ireland to Scotland (47,823) was almost exactly the same as the number moving in the opposite direction (47,766) – and they only accounted for less than 1 per cent of the Scottish population. Almost 29,000 people (0.6 per cent of the Scottish population) had moved to Scotland from abroad. (As stated above, the Census does not record the number of people moving in the opposite direction.)
Table 2.1 Persons living in Scotland and those living elsewhere in UK who lived in Scotland one year before the Census
Number |
Percentage |
|
|---|---|---|
All persons in Scotland at Census time |
5,062,011 |
100.0 |
Lived at same address one year previously |
4,474,969 |
88.4 |
No usual address one year previously |
36,562 |
0.7 |
Moved within Scotland in previous year |
473,789 |
9.4 |
Within same council area |
359,965 |
7.1 |
From elsewhere in Scotland |
113,824 |
2.2 |
Moved to Scotland in previous year |
76,691 |
1.5 |
From elsewhere in the UK |
47,823 |
0.9 |
From outwith the UK |
28,868 |
0.6 |
Moved from Scotland in previous year |
.. |
.. |
To elsewhere in the UK |
47,766 |
0.9 |
To outwith the UK |
.. |
.. |
.. Not available
Tendency to migrate by selected characteristics
In the following paragraphs, migration is measured as a percentage of the resident population.
Age and sex
Figure 2.3 shows that the 16-24 age group is more likely to have moved in the year before the Census than any other age group. Over a quarter of this age group moved compared with under 4 per cent of those aged 65-74. The migration rate increased again for people who were aged 85 or over – who probably had to move address because of poor health.
Males were only marginally more likely to be migrants than females. 11.9 per cent of male residents had a different address 1 year before the Census as opposed to 11.3 per cent for females.
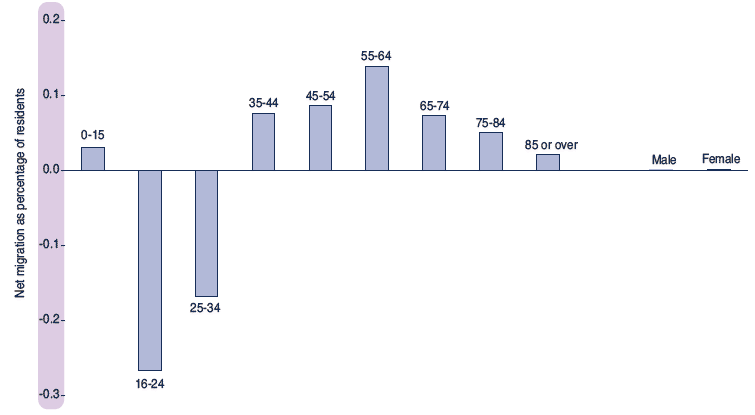
Of the categories in Figure 2.3, one – migrants from elsewhere in the UK – can be compared with a corresponding reverse flow. The difference between these flows is depicted in Figure 2.4 which shows, for example, that more people aged 16 to 24 left Scotland for the rest of the UK than moved in the opposite direction (out-migrants constituted 2.52 per cent of the age-group living in Scotland at Census time while in-migrants formed 2.26 per cent - a net difference of -0.26 per cent.) There was also a net loss of 0.17 per cent in the 25-34 age group. At the other points of the age spectrum, Scotland gained migrants.
There was no appreciable difference between males and females in net migration with the rest of the UK.
Figure 2.3 Migration by age and sex, Scotland, 2001
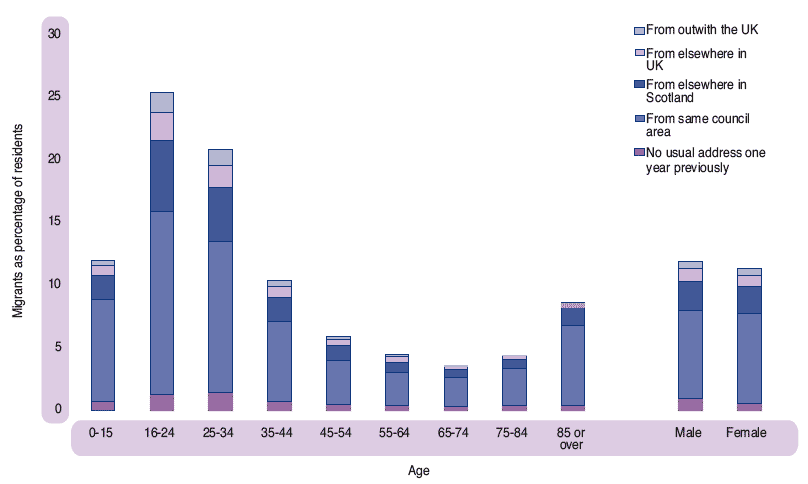
Figure 2.4 Net migration from rest of the UK by age and sex, Scotland, 2001
Ethnic group and country of birth
Figure 2.5 shows the ethnic group and country of birth of migrants. People in non-white ethnic groups are twice as likely to be migrants (22 per cent) than those in white groups (11 per cent) and relatively more of them came from the rest of the UK and from outwith the UK.
Figure 2.5 Migration by ethnic group and country of birth, Scotland, 2001
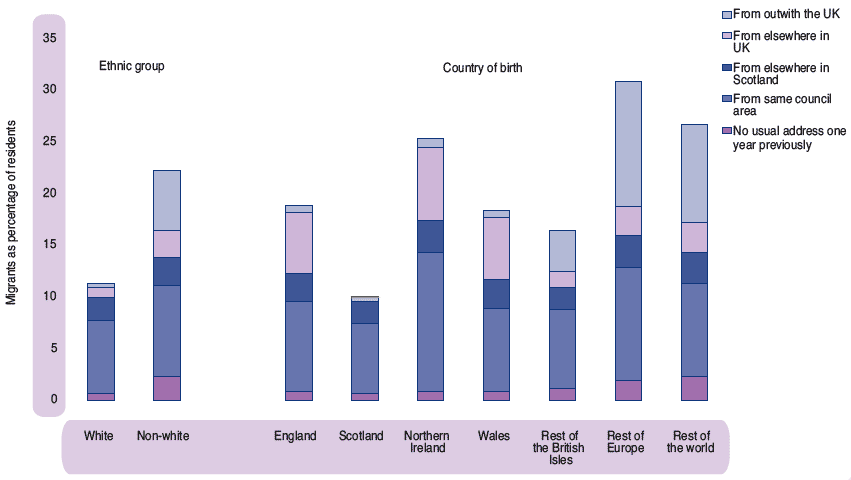
People born outside Scotland were more likely to be migrants than native Scots – even when they were only moving within the same council areas.
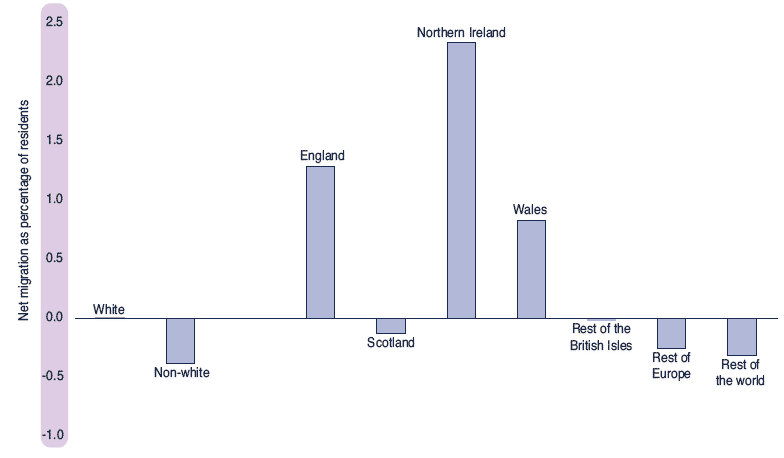
Figure 2.6 shows that more non-white people migrated to the rest of the UK than in the reverse direction. There was a net loss of almost 0.4 per cent of all ethnic minority residents while there was a very slight gain in white migrants. There were also net losses among those born in Scotland and countries outside the UK with net gains of 1.3, 2.3 and 0.8 per cent respectively among those born in England, Wales and Northern Ireland.
Figure 2.6 Net migration from rest of UK by ethnic group and country of birth, Scotland, 2001
Illness, health and caring
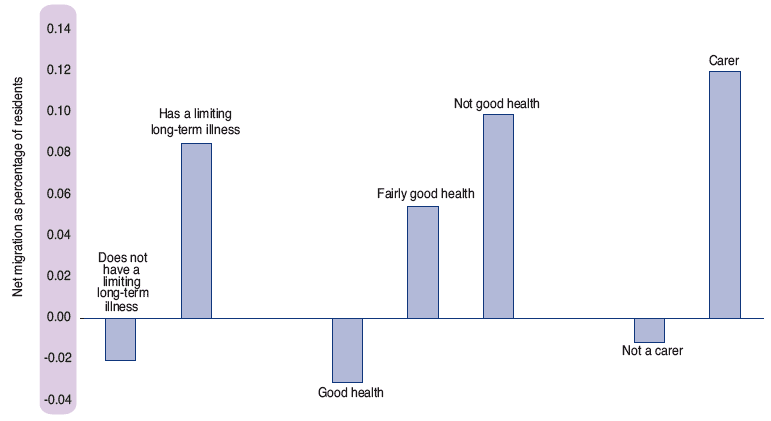
Figure 2.7 shows that people with a limiting long-term illness, carers or people whose health was not ‘good’ were less likely to migrate. People with a limiting long-term illness were 8.1 per cent likely to have been migrants as opposed to 12.5 per cent of those with no such illness. Of those in good health, 12.5 per cent were migrants compared with 9.8 per cent and 9.2 per cent for those with fairly good health and of not good health respectively. The differential increases for those moving from further afield. For example, 1.1 per cent of people in good health had moved from the rest of the UK compared to 0.7 and 0.5 per cent respectively for those in fairly good health and not in good health.
Migration with the rest of the UK (Figure 2.8) was marked by net losses in those without a long-term limiting illness, those in good health and those who did not provide care to family or friends.
Figure 2.7 Migration by illness, health and caring, Scotland, 2001
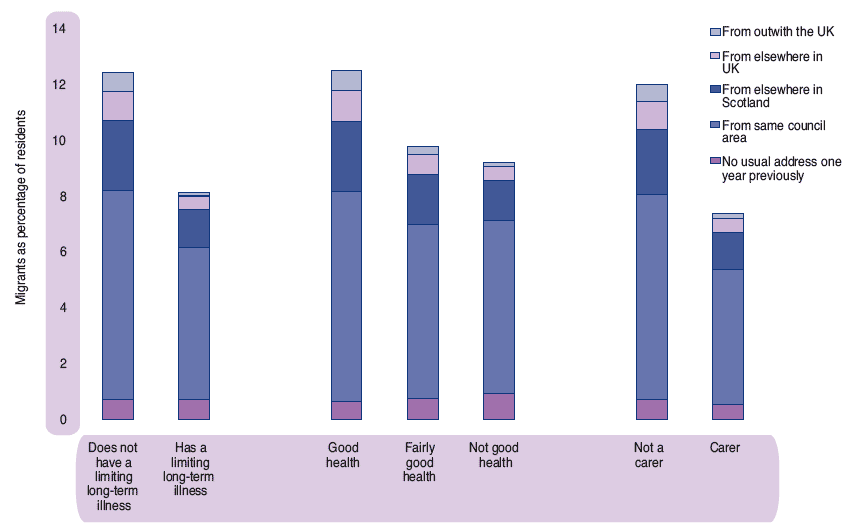
Figure 2.8 Net migration from rest of UK by illness, health and caring, Scotland, 2001
Economic position and occupation
Students were much more likely than others to be migrants with over a quarter (27.1 per cent) having moved in the year before the Census. There was also a high proportion (18.3 per cent) of migrants among the unemployed (see Figure 2.9). The economically inactive (8.3 per cent of whom were migrants) were less likely than the active to have moved in the year before the Census. This differential of around 3-2-1 applied roughly to each category of migrant except for those with no usual address one year before the Census – who were relatively common among the unemployed.
There was above average migration among the two occupation groups Professional Occupations and Associate Professional and Technical Occupations, with over 14 per cent of each group being migrants – compared with 12.1 per cent for all persons aged 16-74. Migration was relatively uncommon among the two groups Skilled Trades Occupations and Process, Plant and Machine Operatives, less than 10 per cent of whom were migrants.
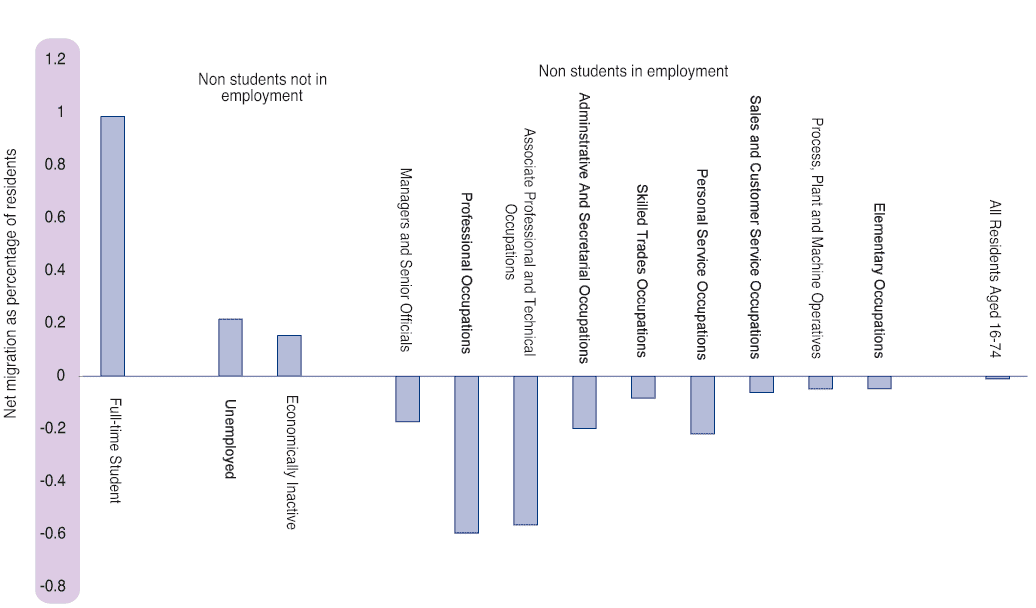
There were net gains in migration with the rest of the UK in full-time students, unemployed and economically inactive people (Figure 2.10). There were net losses in all categories of occupation among persons in employment. The highest net losses were in the relatively mobile groups identified in the previous paragraph: Professional Occupations and Associate Professional and Technical Occupations.
Figure 2.9 Migration of 16-74 year olds by economic position and occupation, Scotland, 2001
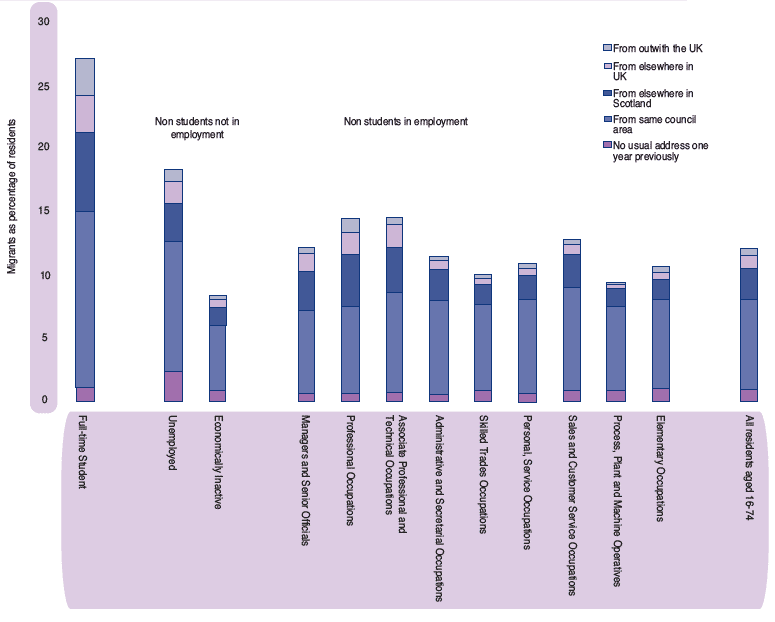
Figure 2.10 Net migration of 16-74 year olds from rest of UK by economic position and occupation, Scotland, 2001
Level of qualification
Among persons aged 16 to 74, those with degree level qualifications were twice as likely to have been migrants as persons with no qualifications (Figure 2.11). They were more likely to have moved from one council area to another or to have moved into Scotland than those with lower or no qualifications.
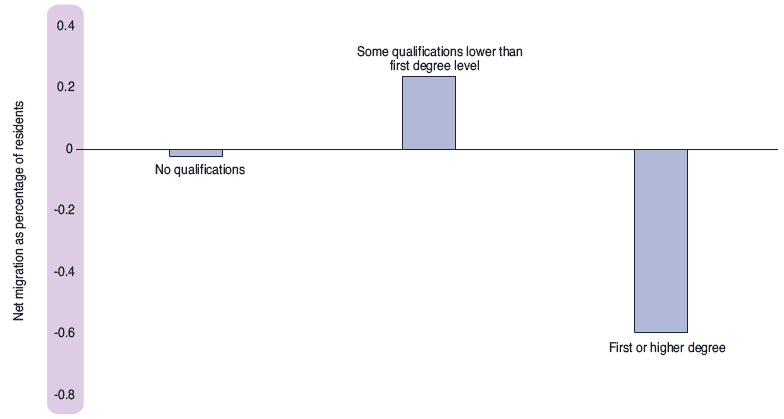
Figure 2.12 shows that Migration with the rest of the UK was marked by a net loss of persons with degrees or higher qualifications (over 0.5 per cent of residents aged 16 to 74) and a smaller net gain in those with lower qualifications. There was a very small net loss in persons with no qualifications.
Figure 2.11 Migration of 16-74 year olds by highest level of qualification, Scotland, 2001
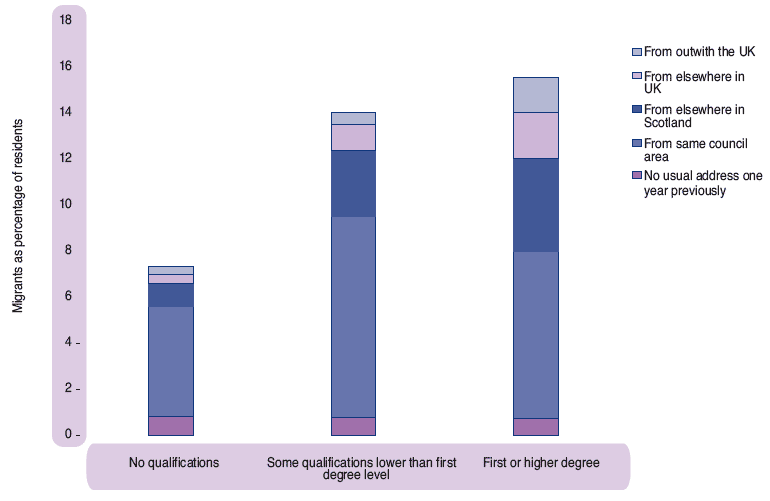
Figure 2.12 Net migration of 16-74 year olds to and from regions of the UK by highest level of qualification, Scotland, 2001
Migration to and from regions of the UK
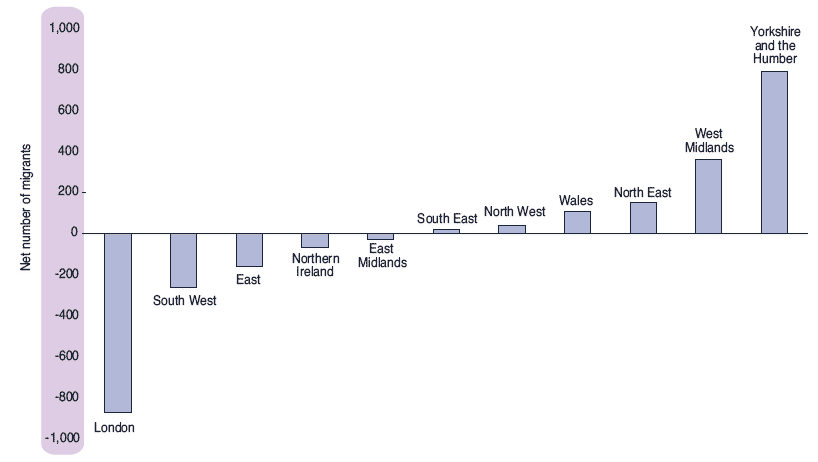
Although the number of people moving from Scotland to the rest of the UK almost exactly matched the number of people moving in the opposite direction, there was a lot of variation in the position in different parts of the UK – as Figure 2.13 shows. Over 800 more people moved from Scotland to London than moved in the opposite direction. At the other end of the scale, there was a net gain of almost 800 to Scotland from Yorkshire and the Humber.
Figure 2.13 Net migration to rest of UK by region, Scotland, 2001
Age
When net migration is broken down by age, there is a net loss in younger age groups (16 to 34) principally to London, the South East and the East regions of England (Table 2.2). There were also net losses of over 100 in the 25 to 34 age group to Northern Ireland and the North West of England, and in the 0 to 15 age group to the South West of England and Northern Ireland. Large net gains were seen in most other age groups from London, and the South East and the East regions of England. However, the largest net gain was in the age group 16 to 24 from Northern Ireland.
Table 2.2 Net migration by UK region and age group, Scotland, 2001
Region of UK |
Age group |
Total |
|||||||||
|---|---|---|---|---|---|---|---|---|---|---|---|
0-15 |
16-24 |
25-34 |
35-44 |
45-54 |
55-64 |
65-74 |
75-79 |
80-84 |
85+ |
||
TOTAL |
303 |
-1,513 |
-1,172 |
596 |
593 |
763 |
330 |
114 |
24 |
19 |
57 |
London |
483 |
-1,452 |
-727 |
343 |
156 |
149 |
122 |
19 |
17 |
14 |
-876 |
South West |
-152 |
-53 |
-76 |
-88 |
-6 |
29 |
58 |
7 |
2 |
14 |
-265 |
East |
26 |
-291 |
-199 |
103 |
75 |
100 |
26 |
4 |
-1 |
-3 |
-160 |
Northern Ireland |
-233 |
608 |
-354 |
-87 |
-12 |
13 |
6 |
1 |
-10 |
-2 |
-70 |
East Midlands |
-76 |
2 |
56 |
-44 |
25 |
15 |
-1 |
-3 |
1 |
-4 |
-29 |
South East |
71 |
-510 |
-189 |
123 |
187 |
212 |
106 |
16 |
1 |
2 |
19 |
North West |
-29 |
6 |
-116 |
-14 |
62 |
105 |
-12 |
31 |
0 |
4 |
37 |
Wales |
18 |
1 |
58 |
37 |
-13 |
12 |
-7 |
-7 |
6 |
0 |
105 |
North East |
-25 |
79 |
29 |
10 |
34 |
7 |
10 |
12 |
5 |
-11 |
150 |
West Midlands |
74 |
-1 |
83 |
40 |
79 |
50 |
21 |
9 |
-3 |
7 |
359 |
Yorkshire and the Humber |
146 |
98 |
263 |
173 |
6 |
71 |
1 |
25 |
6 |
-2 |
787 |
Ethnic group and country of birth
The net loss of almost 400 migrants in non-white ethnic groups to the rest of the UK was shared among all UK regions except Northern Ireland and Yorkshire and the Humber (Table 2.3). There was a large net gain in persons born in England from all English regions and from Wales. Of Scots-born migrants there were large net losses to all regions in the UK. The only large net flow to or from Northern Ireland was a net gain in people born there. There was a similar but less marked pattern for Wales. Generally, there were net losses to most regions in those born outside the UK.
Table 2.3 Net migration by UK region and ethnic group and country of birth, Scotland, 2001
Region of UK |
Ethnic group |
Country of birth | Total |
|||||||
|---|---|---|---|---|---|---|---|---|---|---|
White |
Non- White |
England |
Scotland |
Northern |
Wales |
Rest |
Rest of |
Rest |
||
Total |
444 |
-387 |
5,290 |
-5,663 |
783 |
138 |
-4 |
-137 |
-350 |
57 |
London |
-827 |
-49 |
207 |
-826 |
-54 |
-9 |
-16 |
-121 |
-57 |
-876 |
South West |
-187 |
-78 |
132 |
-347 |
-5 |
5 |
14 |
-2 |
-62 |
-265 |
East |
-77 |
-83 |
408 |
-434 |
-17 |
6 |
-11 |
-30 |
-82 |
-160 |
Northern Ireland |
-83 |
13 |
-84 |
-937 |
980 |
-6 |
2 |
-16 |
-9 |
-70 |
East Midlands |
6 |
-35 |
368 |
-299 |
-38 |
-6 |
-7 |
-24 |
-23 |
-29 |
South East |
77 |
-58 |
1,018 |
-940 |
-41 |
-21 |
20 |
6 |
-23 |
19 |
North West |
96 |
-59 |
890 |
-737 |
-51 |
-28 |
0 |
-4 |
-33 |
37 |
Wales |
106 |
-1 |
112 |
-178 |
3 |
161 |
3 |
17 |
-13 |
105 |
North East |
180 |
-30 |
721 |
-489 |
-15 |
1 |
-3 |
-18 |
-47 |
150 |
West Midlands |
420 |
-61 |
605 |
-216 |
4 |
20 |
-4 |
-1 |
-49 |
359 |
Yorkshire and the Humber |
733 |
54 |
913 |
-260 |
17 |
15 |
-2 |
56 |
48 |
787 |
Illness, health and caring
Scotland tended to lose people who were in good health, had no limiting long-term illness and were not carers (Table 2.4). That tendency was particularly marked for migrants to London and the South of England. On the other hand, Scotland gained such people from Wales, the North East of England, West Midlands and Yorkshire and the Humber.
Table 2.4 Net migration by UK region and illness, health and caring, Scotland, 2001
Region of UK |
Does not |
Limiting |
Good |
Fairly |
Not good |
Not a |
Carer |
Total |
|---|---|---|---|---|---|---|---|---|
Total |
-819 |
876 |
-1,056 |
604 |
509 |
-520 |
577 |
57 |
London |
-1,158 |
282 |
-1,084 |
32 |
176 |
-1,000 |
124 |
-876 |
South West |
-369 |
104 |
-354 |
39 |
50 |
-307 |
42 |
-265 |
East |
-224 |
64 |
-238 |
14 |
64 |
-236 |
76 |
-160 |
Northern Ireland |
-23 |
-47 |
-188 |
116 |
2 |
-52 |
-18 |
-70 |
East Midlands |
-33 |
4 |
-25 |
2 |
-6 |
-59 |
30 |
-29 |
South East |
-116 |
135 |
-250 |
179 |
90 |
-137 |
156 |
19 |
North West |
-99 |
136 |
-112 |
108 |
41 |
5 |
32 |
37 |
Wales |
105 |
0 |
158 |
-41 |
-12 |
95 |
10 |
105 |
North East |
132 |
18 |
164 |
-20 |
6 |
114 |
36 |
150 |
West Midlands |
276 |
83 |
294 |
33 |
32 |
342 |
17 |
359 |
Yorkshire and the Humber |
690 |
97 |
579 |
142 |
66 |
715 |
72 |
787 |
Economic position and occupation
Among migrants who were full-time students at the time of the Census, there were net gains in moves to and from regions of the UK in all cases except the North East of England (Table 2.5). In particular there was a net gain of 1,270 from Northern Ireland (consisting of gross flows of 1,414 and 144 respectively to and from Scotland).
Table 2.5 Net migration by UK region and economic position and occupation, Scotland, 2001
Region of UK |
Full-time student |
Non students |
Non students in employment |
All migrants aged 16-74 |
|||||||||
|---|---|---|---|---|---|---|---|---|---|---|---|---|---|
Unemployed |
Economically inactive |
Managers and Senior Officials |
Professional Occupations |
Associate Professional and |
Administrative and |
Skllled Trade Occupations |
Personal Service Occupations |
Sales and Customers Services Occupations |
Process, Plant and Machine Operatives |
Elementary Occupations |
|||
Total |
2,624 |
320 |
1,779 |
-473 |
-1,444 |
-1,751 |
-561 |
-229 |
-338 |
-98 |
-108 |
-124 |
-403 |
London |
70 |
93 |
569 |
-296 |
-606 |
-747 |
-328 |
-66 |
-68 |
-46 |
2 |
14 |
-1,409 |
East |
92 |
70 |
202 |
-8 |
-177 |
-188 |
-41 |
-26 |
-76 |
-7 |
-17 |
-10 |
-186 |
South West |
146 |
23 |
123 |
86 |
-109 |
-96 |
-58 |
-102 |
-47 |
-32 |
-33 |
-37 |
-136 |
South East |
440 |
188 |
427 |
-144 |
-201 |
-431 |
-137 |
-88 |
-42 |
-38 |
1 |
-46 |
-71 |
North West |
208 |
-32 |
185 |
-80 |
-65 |
-141 |
50 |
-11 |
-41 |
19 |
-30 |
-31 |
31 |
East Midlands |
140 |
32 |
11 |
-51 |
-47 |
59 |
-29 |
-11 |
-22 |
3 |
-12 |
-20 |
53 |
Wales |
27 |
-2 |
-19 |
-4 |
30 |
75 |
-3 |
-3 |
-13 |
11 |
6 |
-17 |
88 |
North East |
-64 |
-47 |
37 |
66 |
-61 |
169 |
20 |
34 |
-19 |
-23 |
20 |
37 |
169 |
Northern Ireland |
1,270 |
-104 |
-115 |
-90 |
-87 |
-538 |
-76 |
9 |
-24 |
-12 |
-27 |
-32 |
174 |
West Midlands |
144 |
24 |
140 |
-16 |
-44 |
3 |
23 |
4 |
-4 |
8 |
-20 |
10 |
272 |
Yorkshire and the Humber |
151 |
75 |
219 |
64 |
-77 |
84 |
18 |
31 |
18 |
19 |
2 |
8 |
612 |
Among other migrants, those who were unemployed at the time of the Census showed net gains from most regions with the exception particularly of Northern Ireland which showed a net loss of 104. For economically inactive migrants, there was a pattern similar to that for the unemployed, with relatively large net gains from London and the South East.
Among non-student migrants who were working at the time of the Census, there were generally net losses for most occupation groups, particularly to London for the two groups Professional Occupations and Associate Professional and Technical Occupations. There was also a large net loss in the latter group to Northern Ireland.
Qualifications
Among migrants with a first degree or higher qualification, there was an overall net loss of over 4,000 to the rest of the UK (Table 2.6). This was distributed among all regions of the UK except Wales. For those regions where there was a net gain in migrants aged 16 to 74, there were relatively high net losses in migrants with degrees to the North West and to Northern Ireland. There was a corresponding gain in migrants with qualifications below degree level from all regions. Among migrants with no qualifications, there were net losses to all regions except London and the South East.
Table 2.6 Net migration by UK region and highest level of qualification, Scotland, 2001
Region of UK |
No |
Some |
First or |
All |
|---|---|---|---|---|
Total |
-264 |
4,185 |
-4,324 |
-403 |
London |
283 |
568 |
-2,260 |
-1,409 |
East |
-5 |
273 |
-454 |
-186 |
South West |
-71 |
137 |
-202 |
-136 |
South East |
31 |
401 |
-503 |
-71 |
North West |
-67 |
468 |
-370 |
31 |
East Midlands |
-51 |
265 |
-161 |
53 |
Wales |
-59 |
61 |
86 |
88 |
North East |
-76 |
289 |
-44 |
169 |
Northern Ireland |
-245 |
781 |
-362 |
174 |
West Midlands |
-7 |
326 |
-47 |
272 |
Yorkshire and the Humber |
3 |
616 |
-7 |
612 |
Migration to and from the council areas of Scotland
This section examines migration to and from the 32 council areas of Scotland. For this purpose, migration is again measured as a proportion of the resident population.
Scale of migration
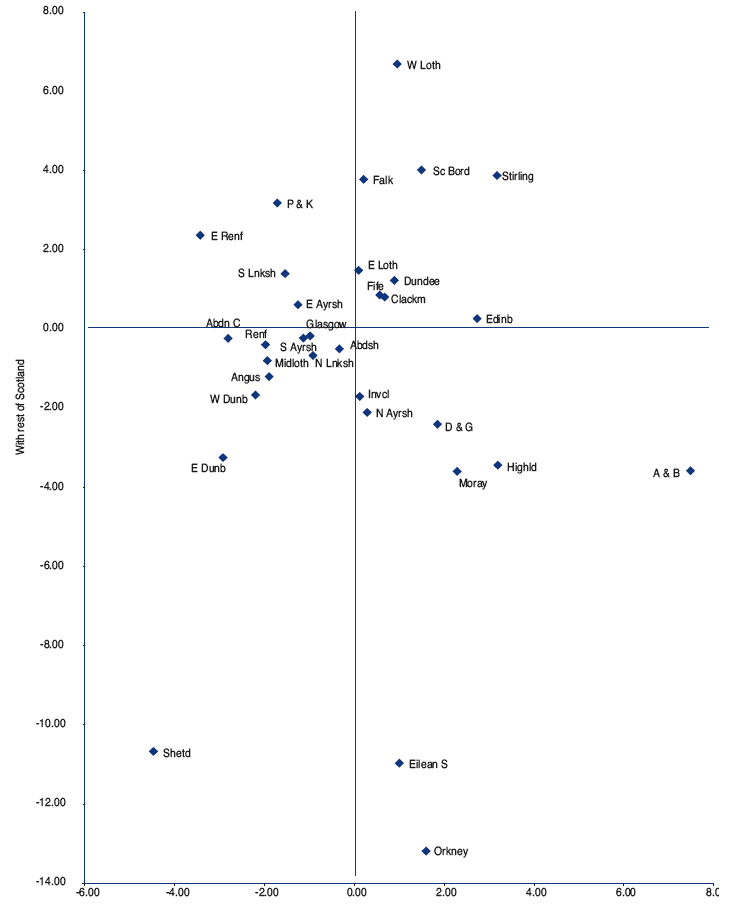
In Figure 2.14, net migration to and from the rest of Scotland is compared to net migration to and from the rest of the UK. (Although proportional net losses and gains are high for some council areas, the absolute numbers for smaller areas are low.)
A grouping of council areas based on their location in Figure 2.14 was considered for this section but rejected because it was not sustained in the later figures. For example, in many of the later figures the 4 city council areas (Aberdeen, Dundee, Edinburgh and Glasgow) occur together alongside certain other areas containing universities. In Figure
2.14 however, Aberdeen and Glasgow are shown as having a net loss in migration to the UK outside Scotland – while the other areas show gains. Another set of areas that prove difficult to classify are the three island areas (Eilean Siar, Orkney and Shetland). Although they occur close together in Figure 2.14, they do not invariably occur together in other figures in the section.
Argyll & Bute (with large military establishments) had the largest net gain in migration from the rest of the UK – but it also had a relatively high net loss to the rest of Scotland. The greatest net percentage losses in migration to the rest of Scotland were from the three islands areas, with Shetland also showing a high net loss to the rest of the UK. Inverclyde, North Ayrshire, Dumfries & Galloway, Highland and Moray, like Argyll & Bute, had a combination of net loss to the rest of Scotland and net gain from the rest of the UK.
The City of Edinburgh, Dundee City, Fife and Stirling are areas containing universities that had net gains from both the rest of Scotland and the rest of the UK. Other areas with net gains in both respects were West Lothian (which had the highest net gain from the rest of Scotland), Falkirk, Scottish Borders, East Lothian, and Clackmannanshire.
Perth & Kinross, South Lanarkshire, East Renfrewshire, and East Ayrshire are areas that had net gains from the rest of Scotland but net losses from the rest of the UK.
All other areas had net losses to both the rest of Scotland and to the rest of the UK.
Figure 2.14 Net migration as percentage of residents, Council areas, 2001

Age
This section presents summary information on the age of migrants by comparing the average ages of residents and migrants and the average ages of different groups of migrants. More detailed analyses, for example, examining the migration of particular age groups, will be published in a GROS Occasional Paper.
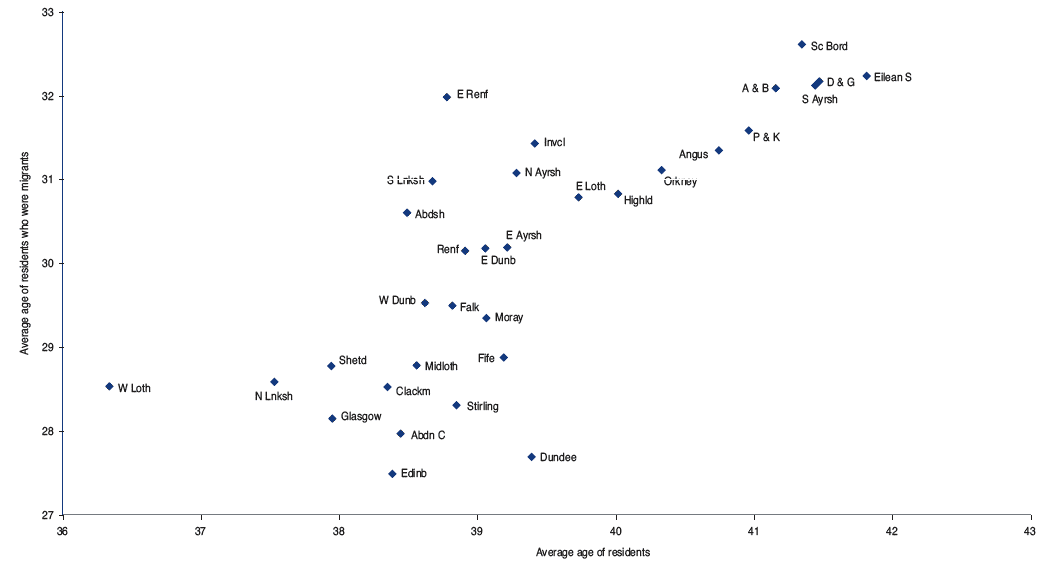
Migrants were, on average, younger than residents generally. The average age of all residents in Scotland in the 2001 Census was 36.4 years. Those who had moved in the previous year were just over 8 years younger – averaging 28.0 years. A similar differential applies to most council areas taken separately even though the age of residents and migrants varied (Figure 2.15). Rural areas tended to have older residents and migrants – with Shetland a notable exception. The cities – and Stirling and Fife, also university areas – tended to be at the younger end of the spectrum.
Figure 2.15 Average age of residents and migrants, Council areas, 2001
The relationship between the average ages of residents and migrants seen in Figure 2.15 also existed for the subset of migrants who had moved from other parts of the UK (Figure 2.16). Migrants were, on average, about 8 or so years younger than the populations they were joining. Again rural areas tended to have older residents and migrants while cities and university areas had younger.
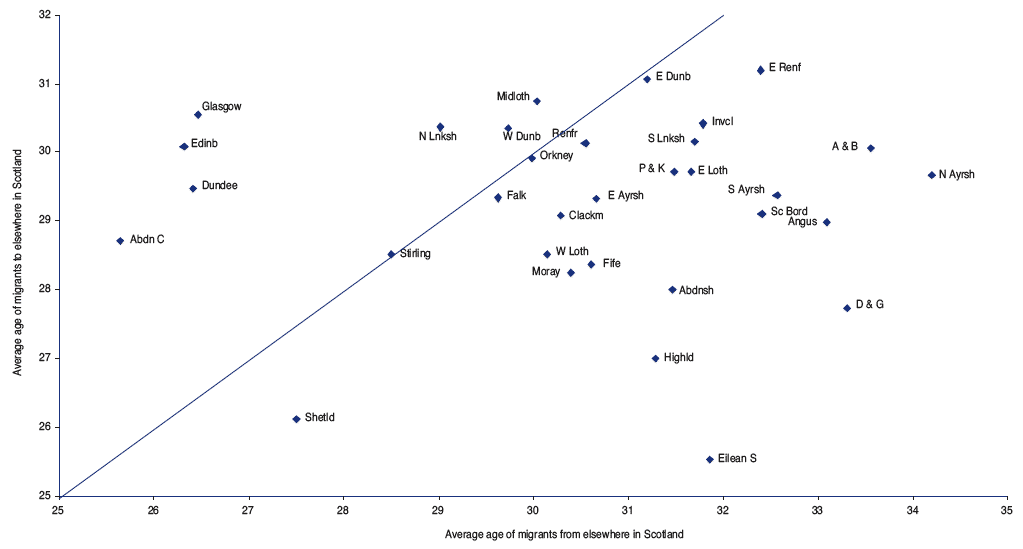
The average age of migrants into each area may be compared with that of out-migrants. Figure 2.17 shows for each council area the average age of migrants to and from the rest of Scotland. A line has been drawn to show where the two average ages are equal.
For most council areas, particularly Eilean Siar, Dumfries & Galloway, and North Ayrshire, in-migrants are generally older than out-migrants. Exceptionally, the cities attracted migrants who were 4 or 5 years younger than out-migrants to the rest of Scotland. Also above the ‘equal-average-age’ line were North Lanarkshire, Midlothian and West Dunbartonshire, with in-migrants from the rest of Scotland on average about 1 year younger than out-migrants.
Figure 2.16 Average age of residents and migrants from rest of UK, Council areas, 2001
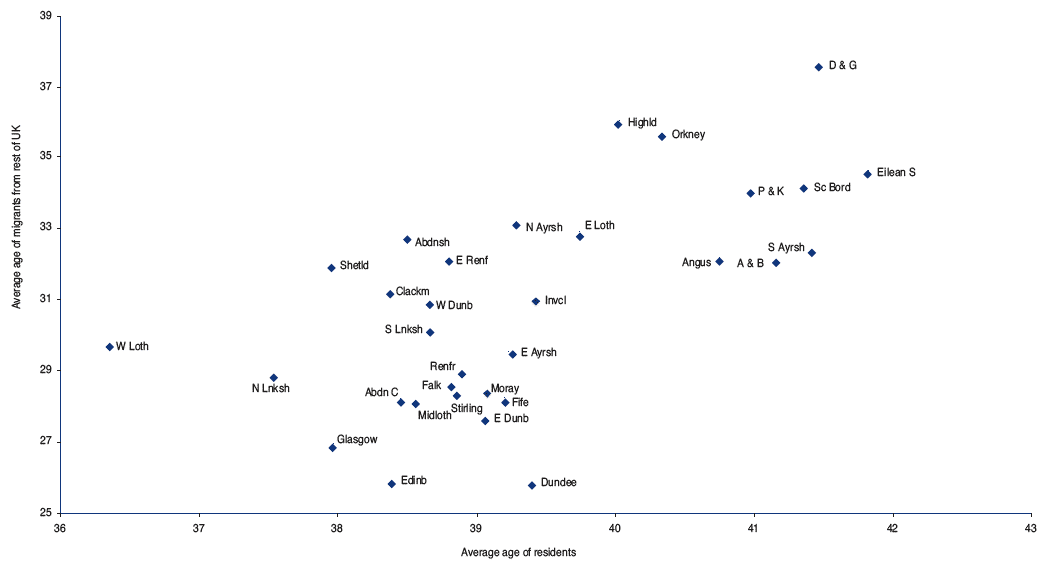
Figure 2.17 Average age of residents to and from the rest of Scotland, Council areas, 2001
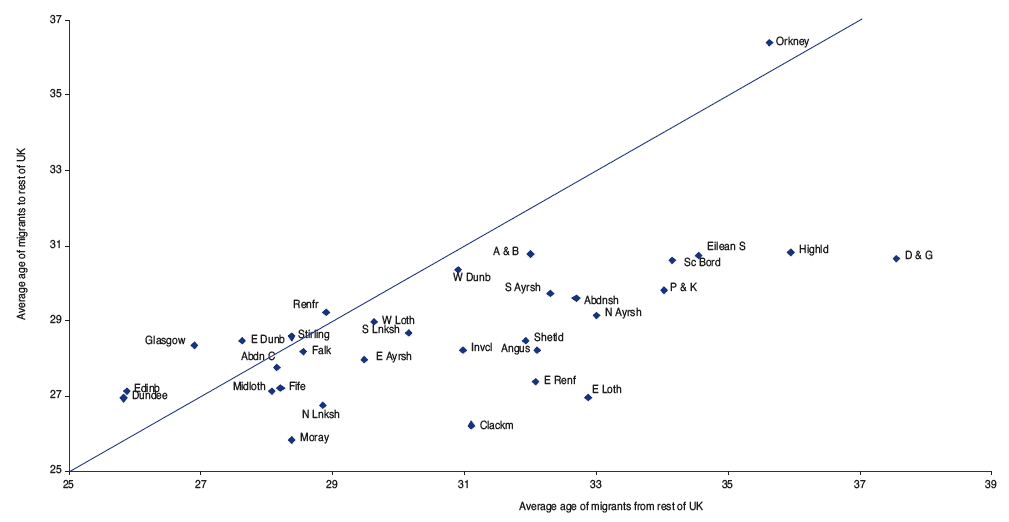
When migration to and from the rest of the UK is compared, a similar pattern is seen with the majority of areas below the ‘equal-average-age’ line meaning that in-migrants were on average older than out-migrants (Figure 2.18).
In certain university areas (the cities - apart from Aberdeen and Stirling), migrants from England and Wales and Northern Ireland are, on average, younger than corresponding out-migrants. Also above the ‘equal-average-age’ line were East Dunbartonshire, Renfrewshire and Orkney. The latter area was marked by the highest average age of migrant to the rest of the UK and the third highest average age of in-migrant. Other rural areas such as Dumfries & Galloway, attracted older in-migrants from the rest of the UK.
Figure 2.18 Average age of migrants to and from rest of UK, Council areas, 2001
Economic Activity
Another indicator for comparing migrants with residents, or one group of migrants with another, is the percentage of persons aged 16 to 74 who were economically active (that is were either in employment or unemployed). As for average age, the percentage of economically active people is a summary indicator. The economically active could be further divided into whether employed or unemployed; the economically inactive into whether in full-time education, retired, permanently sick or looking after the family or home. More detailed analyses of particular categories of economic activity will be presented in a GROS Occasional Paper.
Using the summary statistic of the percentage of persons aged 16 to 74 who were economically active, there is a strong relationship (as there was for average age) between the economic activity of migrants and that of the population they join in each council area (Figure 2.19). The Figure contains a line separating areas where the percentages of residents and migrants aged 16 to 74 were equal.
For Scotland as a whole, the proportion of those aged 16 to 74 who are economically active was 65.0 per cent, while that of residents aged 16 to 74 who moved in the previous year was 3.8 per cent higher. A similar differential existed for most individual council areas. The differential was least in the cities, excluding Glasgow, and Stirling and Fife (perhaps reflecting their student populations).
The economic activity of migrants aged 16 to 74 moving into each area from England, Wales and Northern Ireland was, at 66.5 per cent, slightly less than that for residents generally. Accordingly, the number of areas below the ‘equal-economic-activity’ line in Figure 2.20 was higher than for all migrants in Figure 2.19.
Figure 2.19 Persons aged 16-74, percentage economically active: residents and migrants, Council areas, 2001
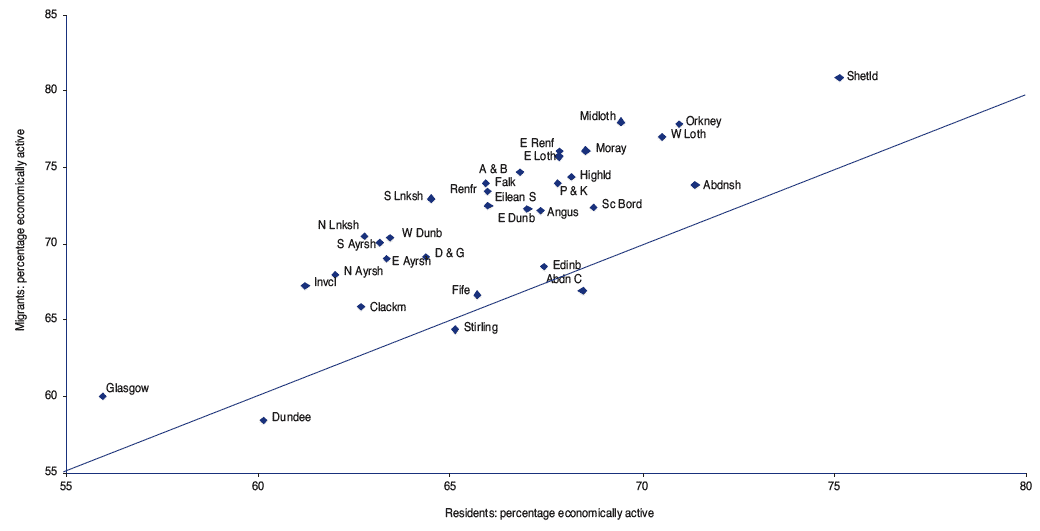
Figure 2.20 Persons aged 16-74, percentage economically active: residents and migrants from rest of UK, Council areas, 2001
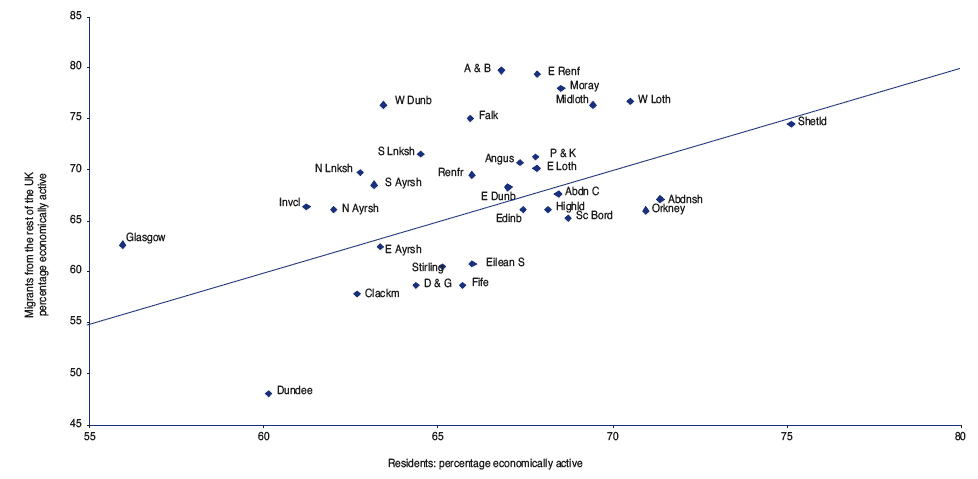
The most extreme example was Dundee where the economic activity of migrants from England, Wales and Northern Ireland was 12 per cent lower than that of residents. The economic activity of this group of migrants was substantially higher than residents in areas with large military bases (Argyll & Bute) and certain commuter areas including East Renfrewshire, Midlothian and West Lothian.
Comparing the economic activity of migrants between each council area and rest of Scotland shows a very large difference for Shetland, with 85 per cent of in-migrants economically active – almost 28 per cent higher than for out-migrants (Figure 2.21).
The differential was also positive for the other islands areas and for rural areas in general. The cities and a number of other areas, particularly Clackmannanshire, lost people less economically active than those gained. For certain commuter areas, such as East Lothian, Midlothian and East Renfrewshire, a relatively high proportion of out-migrants were economically active, as were an even higher proportion of in-migrants.
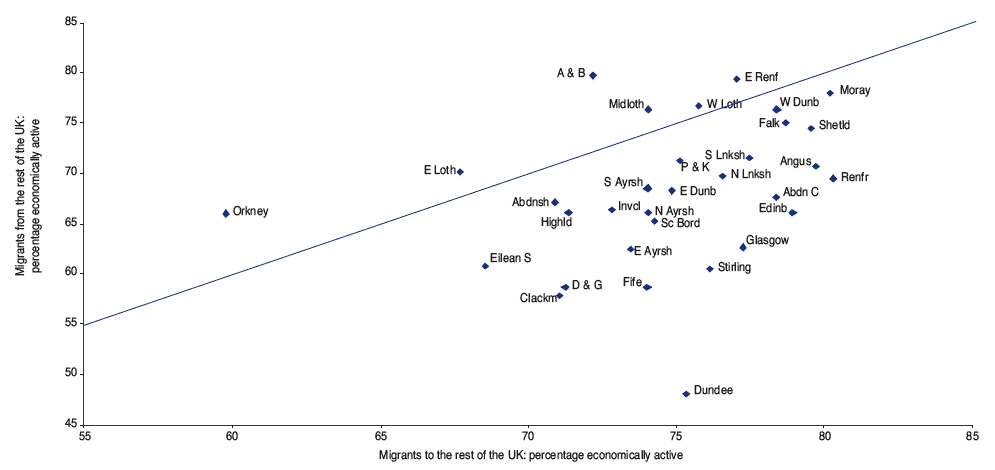
Turning to migration between each area and the UK outside Scotland (Figure 2.22), for all but 6 council areas, out-migrants were, on average, more economically active than in-migrants. The 6 council areas were Orkney, Argyll & Bute and the commuter areas of East and West Lothian, Midlothian and East Renfrewshire. On the other side of the ‘equal-economic-activity’ line, Dundee was again exceptional, but the other cities plus Fife and Stirling, also university areas, all displayed substantial differential economic activity.
Figure 2.21 Persons aged 16-74, percentage economically active: migrants to and from rest of Scotland, Council areas, 2001
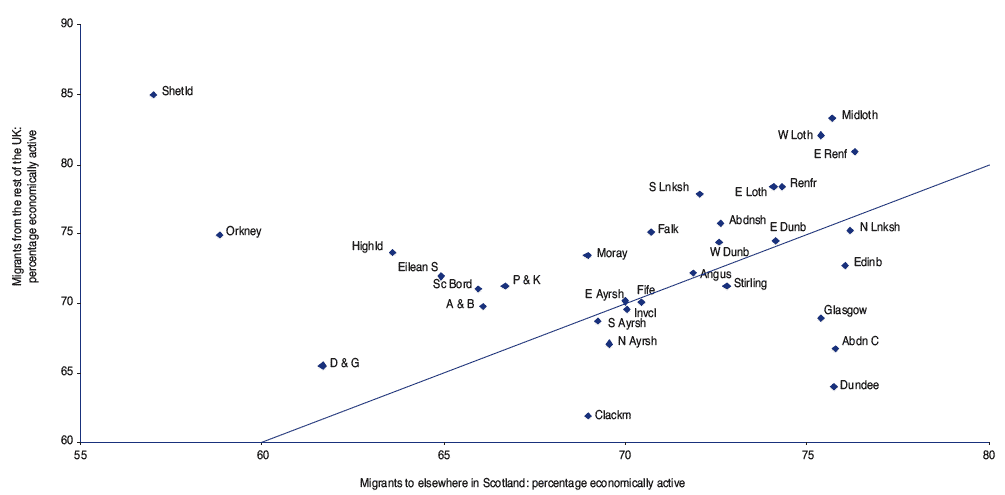
Figure 2.22 Persons aged 16-74, percentage economically active: migrants to and from rest of UK, Council areas, 2001
MIGRATION OF STUDENTS
The migration of students is particularly important because:
Data Sources
The 2001 Census asked people to say whether or not they were in full-time education (although it did not distinguish between people in higher education and other forms of education). Apart from their address, however, the Census did not collect information about the characteristics of a migrant one year before Census day. So the Census can identify migrants who were students at Census time, but not those who were former students: it is difficult to trace the destination of students after their studies.
But data is routinely collected by the Higher Education Statistics Agency (HESA) on the first destination of graduates from all higher education institutions. Students are classified by domicile (identifying Scotland, the rest of the UK and the 15 countries of the European Union before the 2004 enlargement). Their place of study is also identified, distinguishing between Scotland, the rest of the UK and the European Union.
The Evidence of the Census
Figure 2.23 graphs the origin of 19-year-old students in each of the local authority areas in Scotland. The 6 areas on the left hand side all have universities, showing for example that almost 80 per cent of full-time students aged 19 and resident in Edinburgh had moved house in the year before the Census – 36 per cent moving from within the local authority area, 16 per cent from elsewhere in Scotland, 24 per cent from the rest of the UK and almost 4 per cent from outwith the UK. Salient points are:
Figure 2.24 shows the net flow of full-time 19-year-old students within Scotland. It shows, for example, that the number of 19 year olds who came to full-time study in Edinburgh from elsewhere in Scotland, exceeded the number of the same group who left Edinburgh to study elsewhere in Scotland, by a margin of some 10 per cent of Edinburgh’s 19-year-old student residents at the time of the Census.
Figure 2.23 Migration of full-time students aged 19, Council areas, 2001
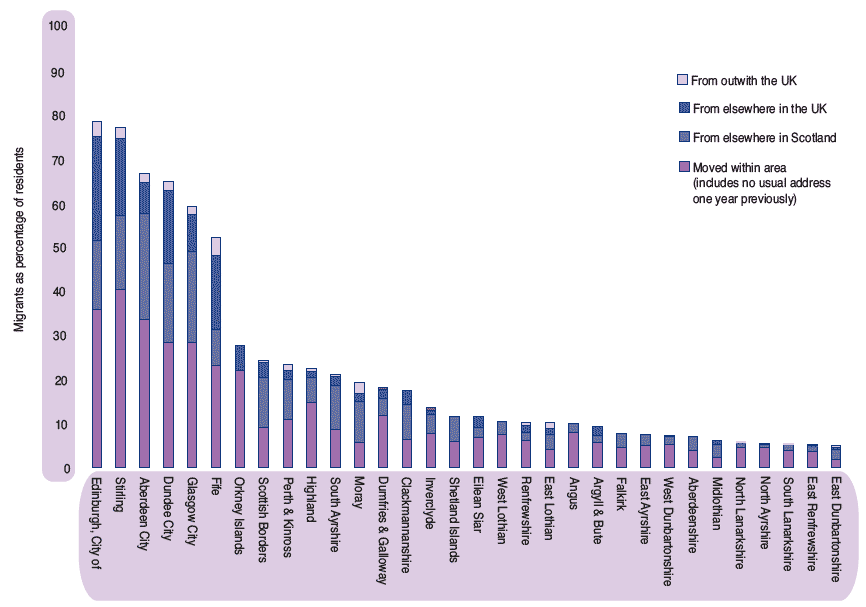
Figure 2.24 Net migration of full-time students under 19 from rest of Scotland, Council areas, 2001
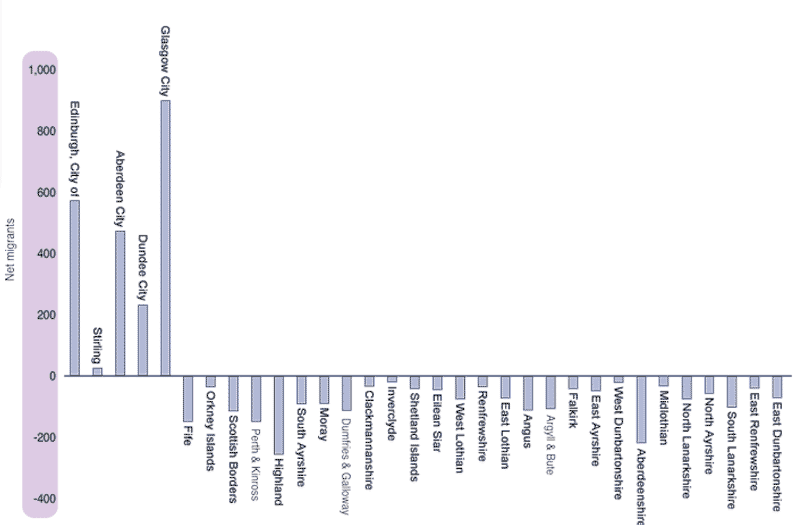
The salient point from Figure 2.24 is that the ‘university’ areas all showed net gains from the rest of Scotland – except for Fife and Renfrewshire, which had a small net loss.
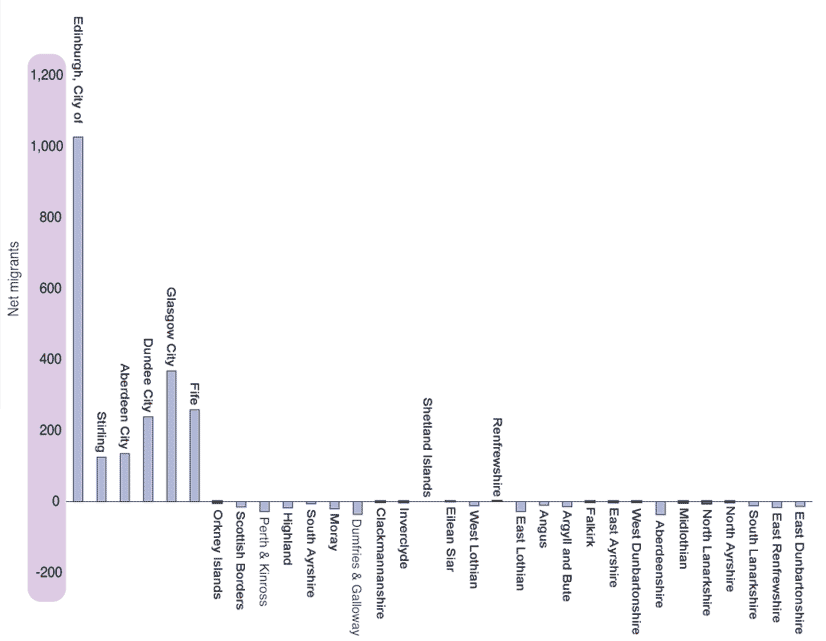
Figure 2.25 gives equivalent information for migration of 19 year old students to and from the rest of the UK. Salient points are:
More generally, the Census shows that:
Figure 2.25 Net migration of full-time students under 19 from rest of UK, Council areas, 2001
Higher Education Statistics Agency data
Table 2.7 gives a breakdown, for 3 academic years, of the percentage of students who had found permanent employment in Scotland within 6 months of graduations5.
Domicile |
Location of HEI |
Academic year |
Percentage with |
Sample size |
|---|---|---|---|---|
Scotland |
Scotland |
1999/00 |
79 |
9,702 |
2000/01 |
85 |
9,839 |
||
2001/02 |
87 |
8,525 |
||
Rest of the UK |
1999/00 |
25 |
943 |
|
2000/01 |
29 |
941 |
||
2001/02 |
28 |
1,013 |
||
Rest of the UK |
Scotland |
1999/00 |
28 |
1,732 |
2000/01 |
30 |
2,143 |
||
2001/02 |
31 |
2,061 |
||
Rest of the UK |
1999/00 |
<1 |
111,411 |
|
2000/01 |
<1 |
114,310 |
||
2001/02 |
<1 |
115,259 |
||
European Union |
Scotland |
1999/00 |
21 |
370 |
2000/01 |
20 |
434 |
||
2001/02 |
22 |
345 |
||
Rest of the UK |
1999/00 |
0 |
4,630 |
|
2000/01 |
0 |
4,617 |
||
2001/02 |
0 |
4,596 |
1 Expressed as a percentage of all gaining permanent UK or overseas employment.
The salient points are: