The latest estimate of Scotland’s population (on 30 June 2005) is 5,094,800 – a rise of 16,400 on the previous year and an increase of 30,600 since 30 June 2001. The population has been rising because, although the number of deaths exceeded births, the natural decrease was more than offset by net in-migration.
In the twelve months to 30 June 2005, there were almost 700 more births and over 1,000 fewer deaths than in the year to end June 2004. Despite this, deaths exceeded births by about 2,300 in the year to 30 June 2005. In the same period, in-migration exceeded out-migration by around 19,000. There was a net gain of around 12,500 from the rest of the UK, a net gain of around 7,300 from overseas (including asylum seekers) and an adjustment of -1,500 for unmeasured migration. Movements to and from the armed forces showed a net gain of around 940 and other changes (including adjustments for the prison population, and changes in the number of armed forces stationed in Scotland) amounted to a net loss of around 600 people.
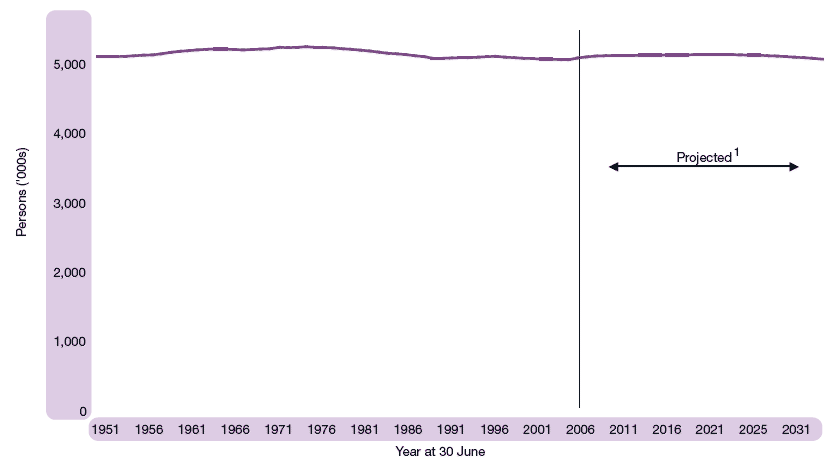
The rise in Scotland’s population in the last three years should be seen in the context of the relative stability of the population over the last 50 years, as shown in Figure 1.1. The population reached a peak of 5.24 million in 1974 and since then has been on a gradually declining trend with some fluctuations until rising slightly in the last three years.
Figure 1.1 Estimated population of Scotland, actual and projected, 1951-2031
1 2004-based projections.
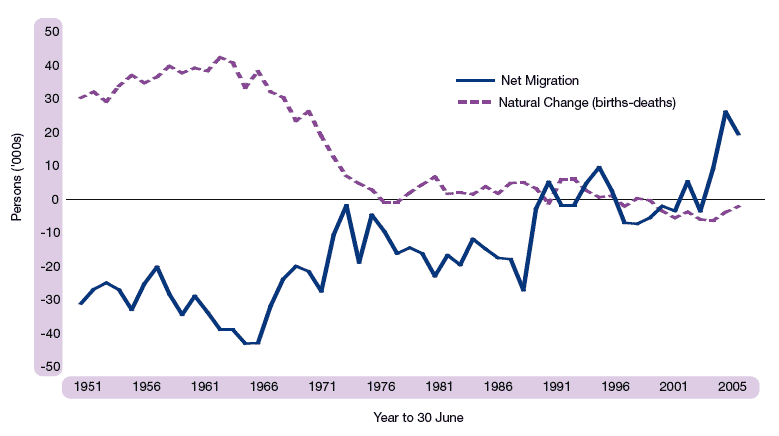
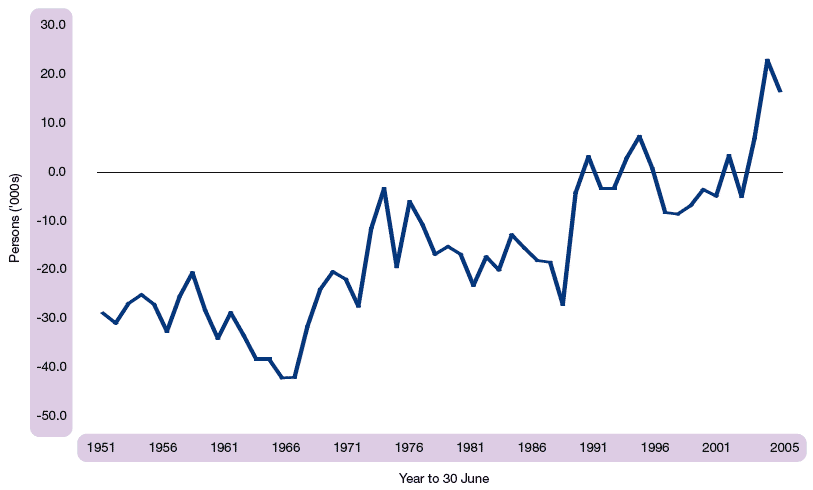
Figure 1.2 shows the trends in natural change (births minus deaths) and migration. The population rose up to 1974 because natural change was greater than net out-migration from Scotland. But, since 1974, natural change has fallen dramatically as a result of a sharp decline in the number of births (from a peak of over 100,000 in the early 1960s to less than 60,000 since 1996), while the number of deaths has remained fairly constant. This fall in natural change was accompanied by a reduction in net out-migration from Scotland. But net out-migration remained higher than the levels of natural change during the late 1970s and 1980s, causing the population to decline. In recent years the gap between births and deaths has been closing and Scotland has experienced record levels of net in-migration. However, these recent trends are still in line with the stable population since 1990.
Figure 1.2 Natural change and net migration, 1951-2005
Age structure
The age/sex composition is one of the most important aspects of the population, as changes in different age groups will have different social and economic impacts. For example, increases in the elderly population are likely to place a greater demand on health and social services.
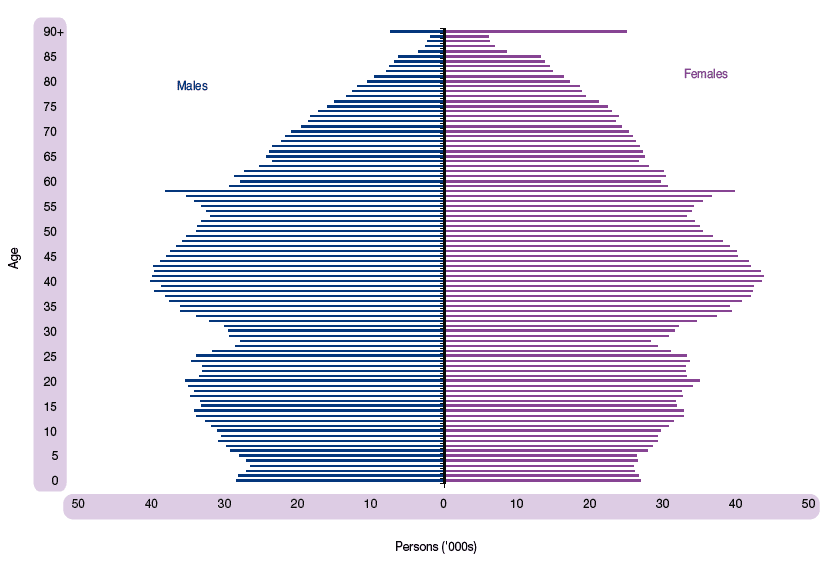
Eighteen per cent of the population was aged under 16 and 19 per cent was of pensionable age (60 and over for women and 65 and over for men), with the remaining 63 per cent of working age (16-59 for women, 16-64 for men). Figure 1.3 shows the age structure of the population in 2005. The higher number of older females (particularly those aged over 75) reflects the longer expectation of life for women, partly as a result of higher rates of male mortality during the Second World War. The effects of the ’flu epidemic in 1918-19 and lower levels of fertility during the First World War are evident from the sharp decline in the population at ages over 84. The two baby booms of 1947 and the 1960s can also be seen, with a sharp peak at age 58 and the bigger bulge between the ages of 35 and 45.
Figure 1.3 Estimated population by age and sex, 30 June 2005
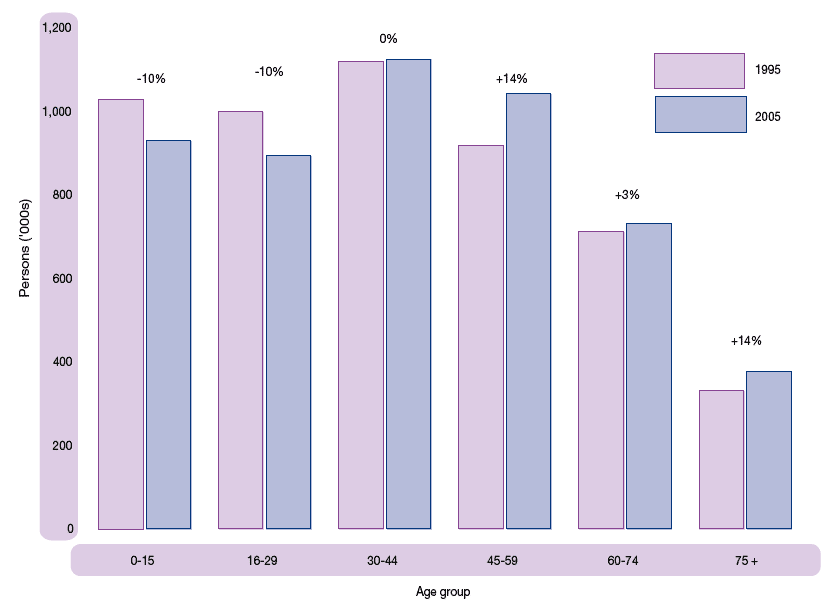
Over the last ten years, Scotland’s population has decreased by around 8,900 (-0.2 per cent): from 5.1 million to 5.09 million. The changing structure of the population since 1995 is illustrated in Figure 1.4. Of particular note is the decrease of 10 per cent in the number of children under 16 and the increase of 14 per cent in the number of people aged 75 and over. The ageing of the population is also evident in the rise of 14 per cent in the 45-59 age group, and the fall of 10 per cent in the 16-29 age group.
Figure 1.4 The changing age structure of Scotland's population, 1995-2005
Changes within Scotland
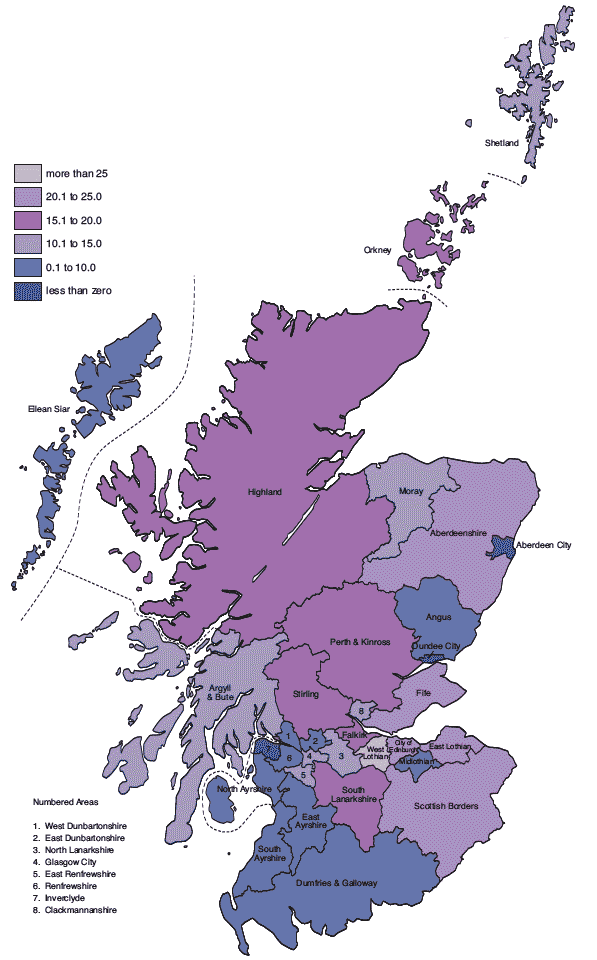
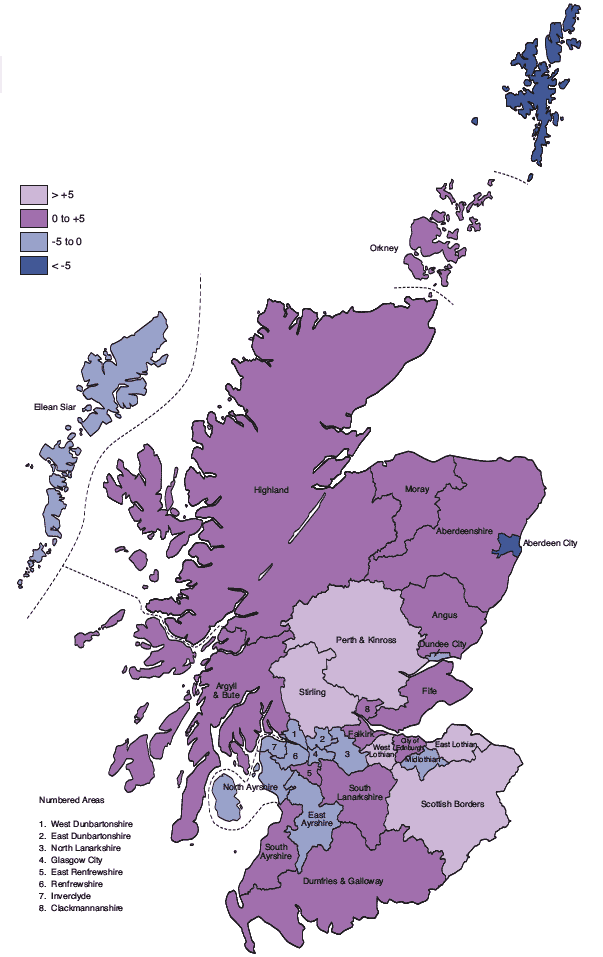
The map at Figure 1.5 shows the percentage change in population between 1995 and 2005 for each Council area. It is better to compare over a time frame longer than one year, as population change tends to fluctuate from year to year, particularly for smaller areas.
Figure 1.5 Percentage population change by Council area, 1995-2005
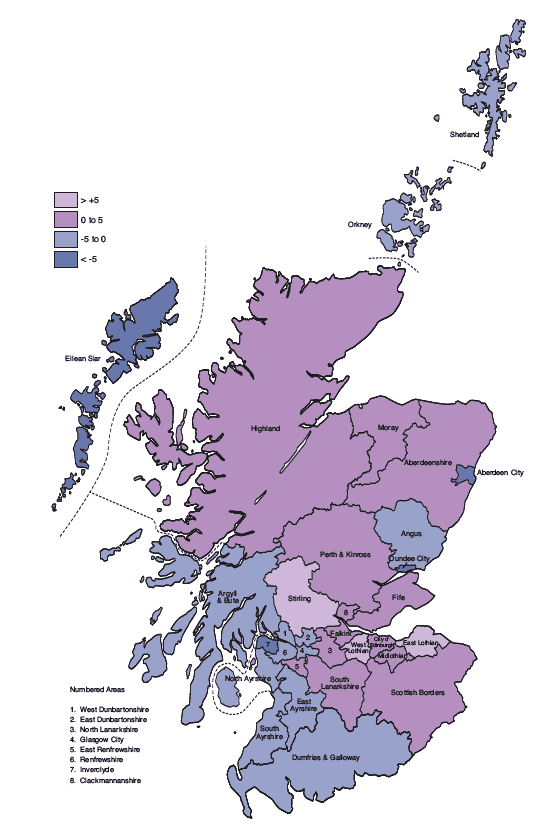
The Council areas where the population fall was greatest were Eilean Siar (-8.5 per cent), Aberdeen City (-8.0 per cent) and Inverclyde (-7.3 per cent). The largest absolute reduction in numbers was in Glasgow City (-25,290). West Lothian (+10.1 per cent), East Lothian (+6.0 per cent) and Stirling (+5.5 per cent) saw the greatest percentage increases.
The relative importance of migration and natural change differs between areas. For example, the areas of population increase include West Lothian, Aberdeenshire, and East Renfrewshire where the population gain is attributable both to gains from migration and to more births than deaths. In other areas, the population increase was due to in-migration, despite fewer births than deaths. These included Fife, Highland, Perth and Kinross, Scottish Borders, and East Lothian. Others with near-zero natural change were Falkirk, Stirling, and Edinburgh.
In areas of decline, the general picture is of net out-migration and more deaths than births – for example in Eilean Siar, Inverclyde, Dundee City, West Dunbartonshire and Glasgow City. Contrasting areas of decline are Aberdeen City, East Dunbartonshire and the Shetland Islands where the main factor is net out-migration. This analysis is shown in Table 1.1 which compares the rates of natural change and migration per 1,000 population across the local authority areas.
Table 1.1 Components of population change for Council areas: 1995-2005
|
Natural |
Net civilian migration |
Percentage |
|---|---|---|---|
SCOTLAND |
-0.7 |
0.5 |
-0.2 |
Council areas (ordered by population change) |
|||
Eilean Siar |
-5.0 |
-3.4 |
-8.5 |
Aberdeen City |
-0.2 |
-7.7 |
-8.0 |
Inverclyde |
-2.7 |
-4.7 |
-7.3 |
Dundee City |
-1.9 |
-4.9 |
-6.7 |
West Dunbartonshire |
-1.4 |
-3.3 |
-4.7 |
Shetland Islands |
1.3 |
-5.5 |
-4.2 |
Glasgow City |
-1.7 |
-2.5 |
-4.2 |
Renfrewshire |
-0.6 |
-3.1 |
-3.6 |
East Dunbartonshire |
0.4 |
-3.9 |
-3.5 |
East Ayrshire |
-1.6 |
-1.1 |
-2.8 |
Angus |
-2.2 |
0.1 |
-2.1 |
South Ayrshire |
-3.6 |
2.0 |
-1.6 |
North Ayrshire |
-1.3 |
-0.1 |
-1.4 |
Argyll & Bute |
-4.0 |
2.8 |
-1.2 |
Orkney Islands |
-1.7 |
0.6 |
-1.1 |
Dumfries & Galloway |
-2.7 |
2.6 |
-0.1 |
North Lanarkshire |
1.2 |
-1.2 |
0.0 |
Clackmannanshire |
0.2 |
0.0 |
0.1 |
Moray |
0.0 |
0.3 |
0.3 |
Midlothian |
0.8 |
-0.4 |
0.4 |
South Lanarkshire |
-0.3 |
0.8 |
0.4 |
Fife |
-0.6 |
2.6 |
2.0 |
East Renfrewshire |
1.2 |
1.2 |
2.4 |
Highland |
-0.7 |
3.3 |
2.6 |
Edinburgh, City of |
-0.2 |
3.3 |
3.1 |
Scottish Borders |
-2.6 |
6.2 |
3.6 |
Perth & Kinross |
-2.1 |
6.0 |
3.9 |
Aberdeenshire |
1.6 |
2.5 |
4.1 |
Falkirk |
-0.1 |
4.7 |
4.5 |
Stirling |
-0.2 |
5.7 |
5.5 |
East Lothian |
-0.6 |
6.6 |
6.0 |
West Lothian |
3.6 |
6.5 |
10.1 |
1 Per year per 1,000 population at 1995.
Source: The underlying data used to produce these figures can be found in Table 6 of the ‘Mid-2005 Population Estimates Scotland’ publication on the GROS website.
Projected population
The latest population projections are based on the estimate of Scotland’s population at 30 June 2004 and on existing trends, making no allowance for the influence of Government policies or other factors. The projections are updated every two years and the next set, based on the 2006 population estimate, will be published in late 2007. The 2004-based projections show the total population of Scotland rising from 5.08 million in 2004 to 5.13 million in 2019 before falling to 5.07 million by 2031 (Figure 1.1). Longer-term projections for up to 40 years ahead show a continuing decline after 2031 to below 5 million in 2036 and to 4.86 million in 2044. The projected reduction in population is therefore very slow and the precise point at which the population reaches a particular level is sensitive to relatively small changes in the underlying assumptions.
The most significant factor affecting the future population level to around 2021 is migration, because the natural decrease (more deaths than births) is likely to be offset by migrants moving to Scotland. However, after 2021 the most significant factor affecting the level of the population is the natural decrease, as the ageing population die in increasing numbers. Figure 1.6 shows a widening gap between births and deaths, with a natural decrease of almost 15,000 a year by 2031. This is likely to be the main reason for long-term population decline in the future.
Figure 1.6 Births and deaths, actual and projected, Scotland, 1951-2031
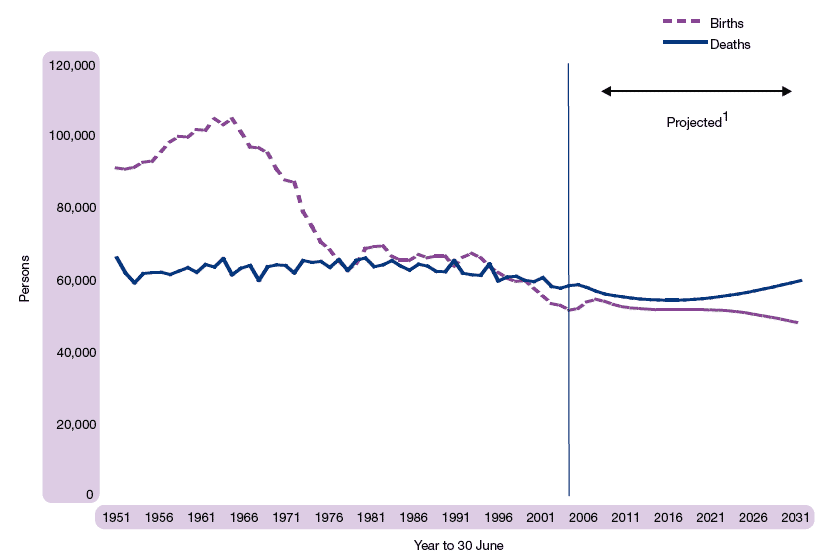
1 2004-based projections
Despite the projected rise in the number of people over the next 15 years, Scotland’s population is still projected to age markedly as shown by Figure 1.7. The main changes between 2004 and 2031 are:
Figure 1.7 The projected percentage change in age structure of Scotland’s population, 2004-20311
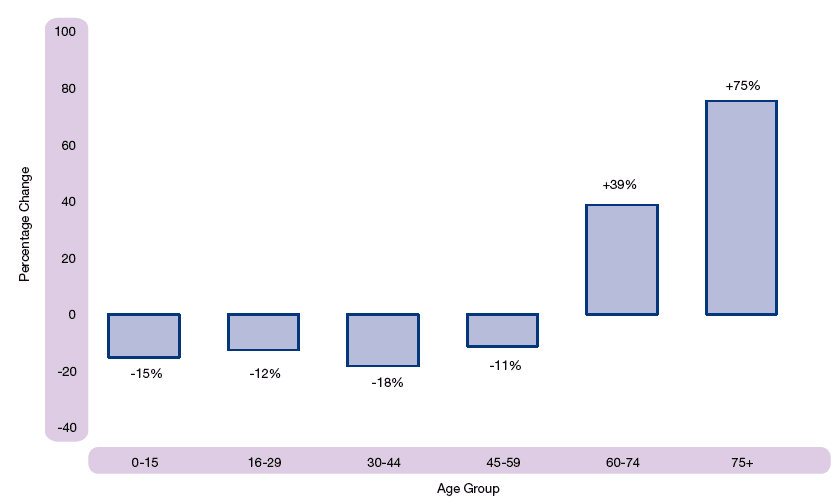
1 2004-based projections
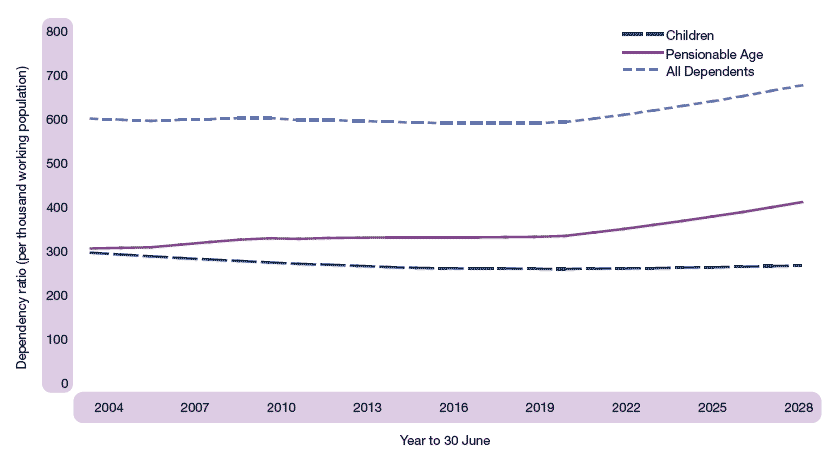
Dependency ratios show the relationship between the working age population and the two main dependent groups – children aged under 16 and people of pensionable age. Figure 1.8 shows this in the long term, with little overall change evident over the next 15 years, but with a relatively rapid increase in the pension age population in relation to the working age population in subsequent years. Over the period up to 2020, rises in the pension age population are largely offset by a reduction in the number of children. Figure 1.8 also reflects the changes being made between 2010 and 2020 to change the state pension age for women from 60 to 65.
Figure 1.8 Dependency Ratios1 (per thousand working population), 2004-2028
1 2004-based projections
Forecasting future demographic changes is a difficult task because it involves predicting the behaviour of people who in some cases have not yet been born, living in a society which will be different from today’s. So, as well as the ‘principal projection’ of Scotland’s population on which the previous paragraphs are based, the Registrar General commissioned a number of variant population projections, based on alternative assumptions of future fertility, mortality and migration. The variant projections give users an indication of this uncertainty. They illustrate plausible alternative scenarios, rather than representing upper or lower limits of future demographic behaviour. These variant projections, and the assumptions used, can be found on the Government Actuary’s Department website (www.gad.gov.uk) and a paper analysing the results for Scotland can be found on the GROS website (/statistics/publications-and-data/popproj/04population-projections-variants/index.html).
Scotland’s position within the United Kingdom and Europe
The United Kingdom population is projected to increase gradually from an estimated 59.8 million in 2004, to reach 67.0 million by 2031.
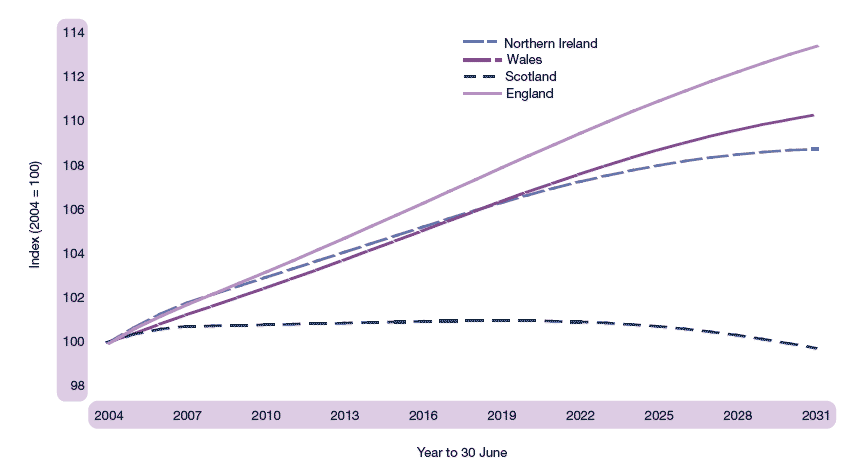
Due to differences in demographic patterns, projected trends differ for the four countries of the United Kingdom. While the population of Scotland is projected to rise, peaking in 2019 and then slowly declining, the populations of the other three countries in the UK are projected to rise to 2031, and continue rising except for Northern Ireland where the population is projected to peak in 2033 and then slowly decline. Figure 1.9 illustrates the projected percentage change in the populations of the four countries from 2004 to 2031.
Figure 1.9 UK nations index of population change, 2004-2031
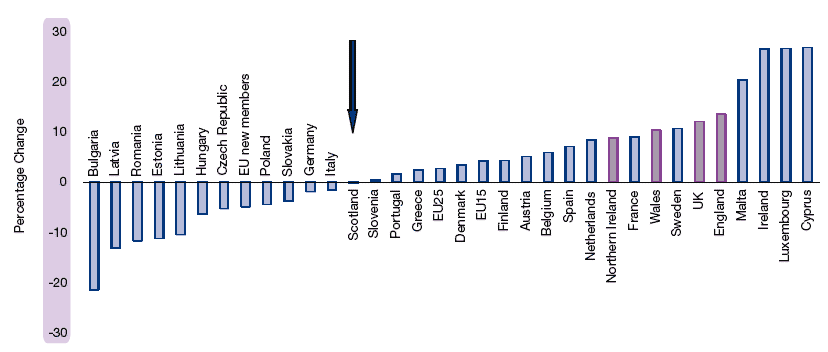
Scotland is not alone in having a natural decrease in population (i.e. deaths exceeding births). But, for most of Europe, this is compensated by higher in-migration than in Scotland. The population of Europe (EU-25) is projected to increase (by 2.7 per cent between 2004 and 2031). On the other hand, Italy, Germany, and seven of the new accession states in Eastern Europe are among the countries with a projected population decline which exceeds Scotland’s over the next 30 years, as Figure 1.10 shows.
Figure 1.10 Projected percentage population change in selected European countries 2004-2031
Source: GAD (UK and constituent countries) and Eurostat. Eurostat also produce an alternative UK projection not shown here.
Nor is the ageing of the population unique to Scotland. The pattern of change over the last twenty years and the projected change in the age distribution is consistent with other countries in the UK and Europe, although the rate of change varies.
Numbers
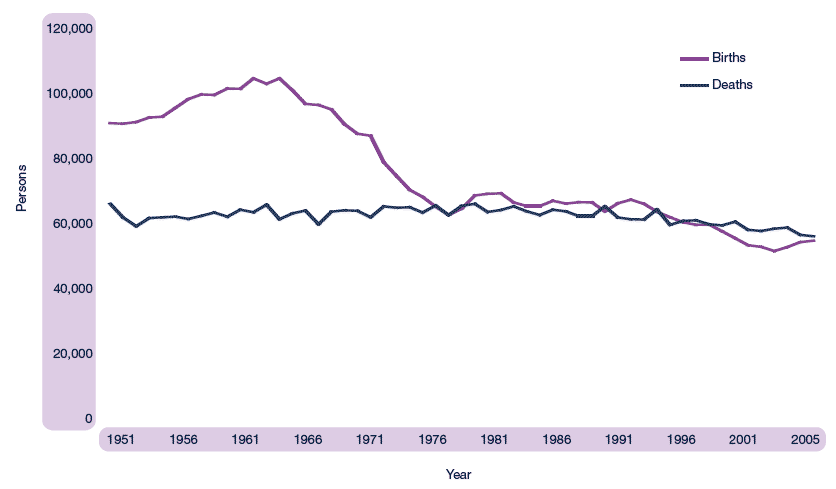
The number of births registered in Scotland in 2005 was 54,386. This was 429 (0.8 per cent) more than in 2004 and 3,116 (6.1 per cent) more than 2002’s total – which was the lowest since civil registration began in 1855, with only half the number of births recorded during the ‘baby boom’ of the early 1960s. The relatively modest increase in 2005, compared with 2.9 per cent in the previous year, suggests that the recent upturn in births may be easing off. The number of births and deaths registered in Scotland since 1951 is plotted in Figure 1.11.
The proportion of births to unmarried parents (including births registered solely in the mother’s name) has continued to rise, reaching 47.1 per cent in 2005 compared to 33.7 per cent ten years earlier and 18.5 per cent in 1985. However, the proportion of births registered solely in the mother’s name has remained relatively constant over this period at 6 to 7 per cent, suggesting that the increase has been in babies born to stable partners who are not married.
Figure 1.11 Births and deaths, Scotland, 1951-2005
Fertility Rates
The simplest fertility rate is the crude birth rate which is defined as the number of live births per 1,000 total population. Appendix 1 Table 1 shows that in 2005 the crude birth rate for Scotland stood at 10.7 compared with around 20 forty years ago. Because it takes no account of the age/gender structure of the population, the crude birth rate has only limited value (e.g. for giving rough comparisons between areas with broadly similar age/gender structures). Appendix 1 Tables 2 and 3 present crude birth rates for administrative areas in Scotland and selected European countries. Appendix 1 Table 2 also gives standardised birth rates for the administrative areas of Scotland: these adjusted birth rates take account of the population structures in the different areas.
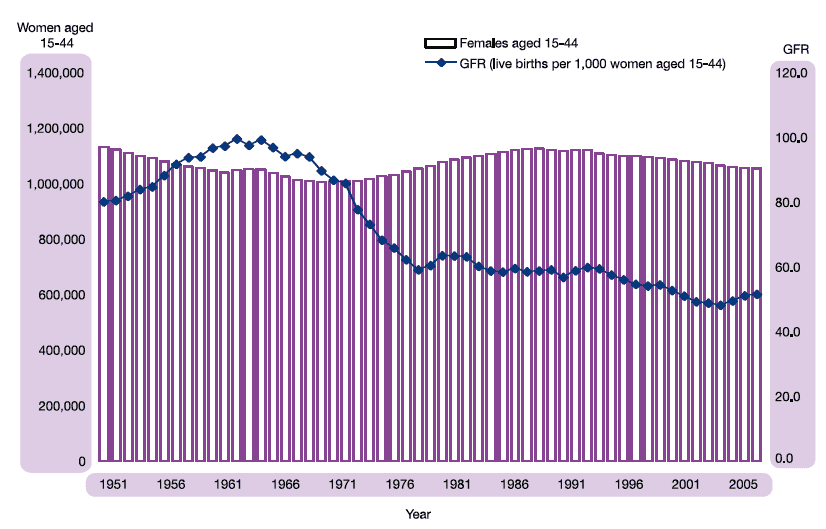
A better approach is to consider the general fertility rate (GFR) which is based on the numbers of women of childbearing age. Figure 1.12 shows the general fertility rate (births per 1,000 females aged 15-44), along with the number of women aged 15-44. During the ‘baby boom’ of the 1960s, the GFR reached 99.5 (in 1962). It then fell sharply to around 60 during the late 1970s and 1980s before declining more slowly during the 1990s, eventually dipping below 50 at the start of the 21st century. It has risen slightly over the last few years to its 2005 value of 51.5. Interestingly, the figure shows that the female population aged 15-44 was relatively low during the baby boom of the 1960s. Moreover, the levelling off in the annual numbers of births during the 1980s was in part associated with the increasing numbers of women born in the 1950s and 1960s, passing through their childbearing years.
Figure 1.12 Estimated female population aged 15-44 and general fertility rate (GFR), Scotland, 1951-2005
A more detailed picture is given by the age specific fertility rates (ASFRs) by mother’s age in five-year age groups in Figure 1.13. This figure shows many significant age-related features of the pattern of childbearing over the last fifty years. The key point is that, as well as choosing to have fewer babies, women are also choosing to have them later in life. Other points of interest are:
Figure 1.13 Live births per 1,000 women, by age of mother, Scotland, 1951-2005
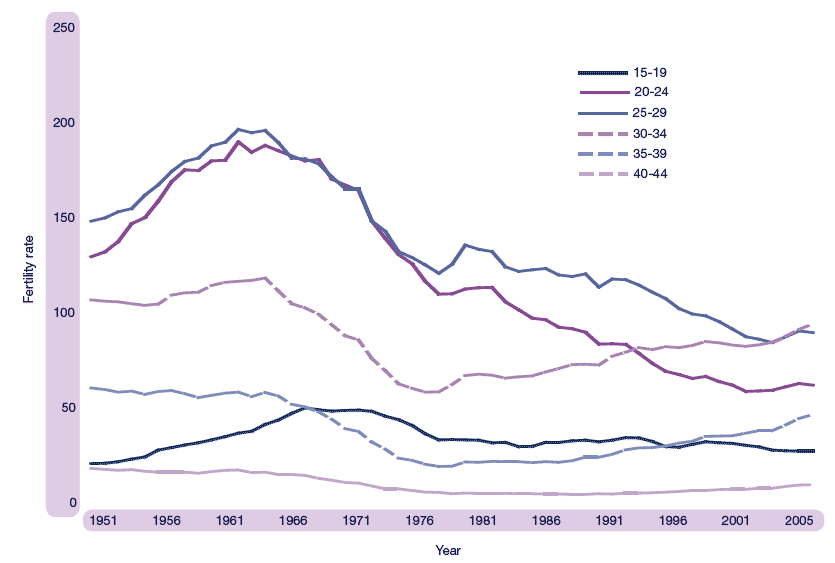
Figure 1.14 further illustrates the ageing pattern of fertility by showing detailed ASFRs for selected years: 1951, 1964, 1977, 1991 and 2005. Though the levels differed considerably, the age patterns of fertility for 1951, 1964 and 1977 were roughly the same. However, the age distribution for 1991 shows a distinctly older peak and that for 2005 reveals the large reduction in fertility of women in their twenties.
Figure 1.14 Live births per 1,000 women, by age, selected years
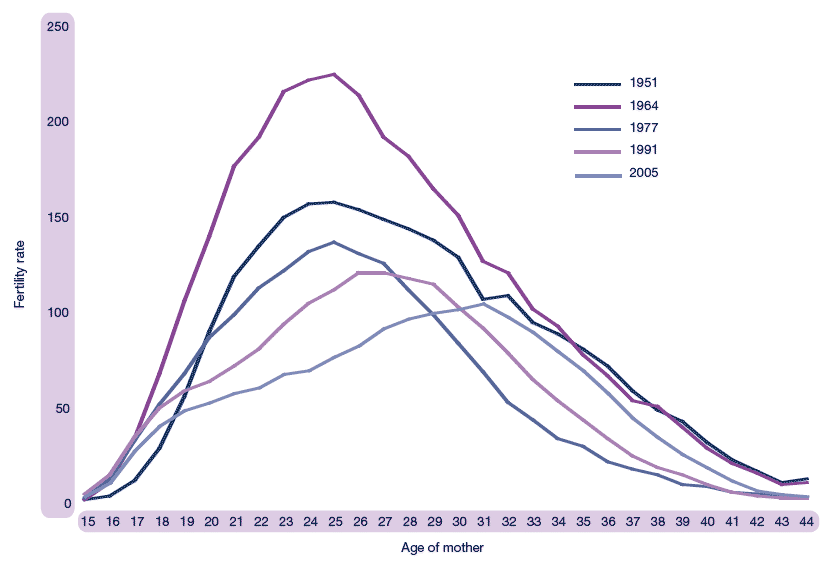
The trend towards later childbearing is underlined by an increase in the average age of mothers for all births to 29.5 in 2005, compared with 27.4 in 1991, 26.1 in 1977, and 27.4 in 1964.
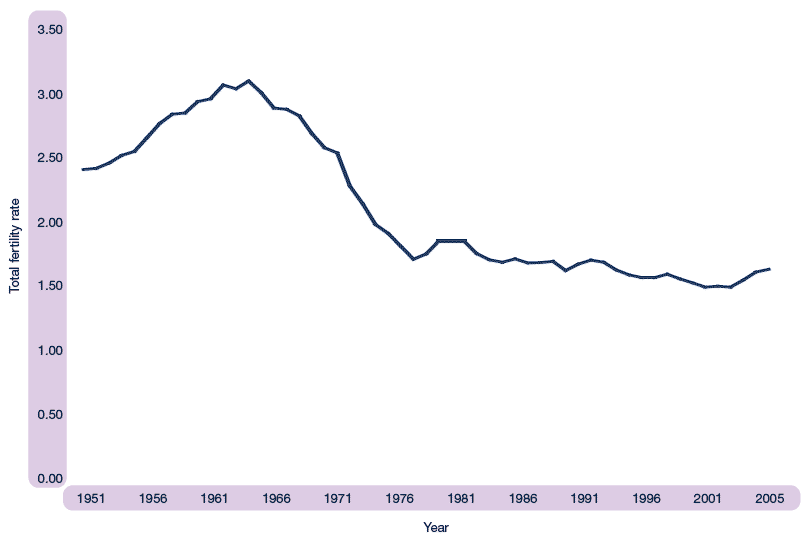
The total fertility rate (TFR) is a commonly used summary measure of fertility levels calculated by summing the age specific rates for a single year. It gives the average number of children that a group of women would expect to have if they experienced the observed ASFRs in each of their childbearing years. For a population to replace itself, the TFR needs to be around 2.1.
The TFR for Scotland since 1951 is plotted in Figure 1.15. Not surprisingly, it follows the same general pattern as the GFR (Figure 1.12). It rose to 3.09 in 1964 before dropping sharply to 1.70 in 1977. Since then, with a few minor fluctuations, it fell more slowly to the 2002 rate of 1.48 before increasing to 1.54 in 2003 and 1.62 in 2005.
Figure 1.15 Total fertility rate, Scotland, 1951-2005
Though widely used, in part because it is relatively easy to calculate, the TFR has serious deficiencies as it is based on only one year’s observations. For example, when women are delaying childbearing, as they have been in Scotland, the TFR is likely to underestimate the number of children women will eventually have.
A more satisfactory measure is average completed family size. Figure 1.16 shows the completed family size (or cumulative cohort fertility) by age for women born in selected years. Those born in 1951 had attained an average completed family size of 2.03 by the time they reached 45, whereas for those born in 1956 the figure was 1.93. The figure also permits the comparison of family size at selected ages for the various cohorts as they pass through the childbearing ages. For example, by age 30 the cumulative childbearing of the 1971 cohort is about 0.6 lower than that of the 1951 cohort. Of crucial importance is the extent to which the later cohorts are falling behind in family building. Whilst the increasing fertility rates of those aged over 30 may lead to some catching-up, it seems highly unlikely that this will increase the average completed family size to the levels attained as recently as the 1960s.
Figure 1.16 Cumulative cohort fertility rate for selected birth cohorts, Scotland
Scotland’s fertility has also been falling relative to fertility in other parts of the United Kingdom. Figure 1.17 compares the TFRs for England, Wales, and Northern Ireland with those for Scotland since 1971. Until the late 1970s, Scotland’s TFR was slightly higher than England and Wales. However, since the early 1980s, Scotland’s TFR has dropped steadily below the levels for England and Wales. In 1971 the TFR for Northern Ireland was markedly higher than for the other three countries. However, over the last 30 years the differential has been significantly reduced. It is interesting to note that the recent slight rise in fertility levels in Scotland has been paralleled elsewhere in the UK.
Figure 1.17 Total fertility rates, UK countries, 1971-2005
More detailed information on births and fertility was given in the Registrar General’s 2002 report, Scotland’s Population 2002. Chapter 2 focused on recent trends in Scottish fertility, comparing these trends with the rest of the UK and Europe and Chapter 3 placed the Scottish fertility experience in a wider geographical context, discussing reasons for low fertility and addressing the scope for policy intervention.
Numbers
At 55,747, the number of deaths registered in Scotland in 2005 was 440 (0.8 per cent) fewer than in 2004 and represented the lowest annual total recorded since the introduction of civil registration in 1855.
Figure 1.11 shows that from 1951 up to the early 1990s the annual number of deaths remained relatively stable at about 60-65,000 a year. Since then the total has declined slowly to its current level.
Stillbirths, perinatal deaths and infant deaths
As can be seen in Figure 1.18, there have been significant improvements in the rates for stillbirths, perinatal deaths and infant deaths in the period since 1971. The stillbirth rate has reduced from 13.1 per 1,000 total births (live and still) in 1971 to 5.3 in 2005, despite a change in the definition of stillbirths in 1992 which reduced the minimum period of gestation from 28 weeks to 24 weeks (thus increasing the numbers classified as stillbirths). The rate of perinatal deaths (stillbirths and deaths in the first week of life) fell from 24.5 per 1,000 total births in 1971 to 7.7 in 2005, an improvement of 68 per cent. The infant death rate (deaths of children aged under 1) has improved by 74 per cent from 19.9 per 1,000 live births in 1971 to 5.2 in 2005.
Figure 1.18 Stillbirth, perinatal and infant death rates, per 1,000 total births, Scotland 1971-2005
* Change in definition of stillbirths from 28 to 24 weeks’ gestation
Whilst the current rates are comparable to those for the UK as a whole, there are several Western European countries that have significantly lower rates (see Appendix 1, Table 3).
Mortality by age
About 60 per cent of deaths were of people aged 75 and over, and a further 20 per cent were between the ages of 65 and 74.
The relative stability in the total number of deaths over recent years masks significant improvements in age-specific mortality. Figure 1.19 shows, for both men and women, selected age-specific mortality rates over the last twenty years relative to the 1981 rates. The three age groups shown (45-64, 65-74 and 75 and over) account for around 95 per cent of all deaths.
At these ages, there have been greater improvements in male than in female mortality. For the 45-64 age group, males and females experienced improvements of 45 per cent and 39 per cent respectively. In the 65-74 age group, males showed an improvement of 42 per cent compared to 35 per cent for females. The greatest differential is in the 75 plus age group, where male mortality has improved by 25 per cent compared to only 10 per cent for females. These changes have narrowed the difference between female and (traditionally higher) male mortality.
Figure 1.19 Age specific mortality rates as a proportion of 1981 rate, 1981-2005
Life expectancy
Although mortality rates in Scotland have generally fallen more slowly than in the rest of the UK and elsewhere in Europe, the improvements are still considerable and the impact is demonstrated in the steadily rising expectation of life.
The expectation of life at birth is a commonly used measure of mortality rates which is particularly helpful in comparing the ‘health’ of a nation through time and for making comparisons with other countries. Figure 1.20 shows that the expectation of life at birth in Scotland has improved greatly over the last 20 years or so, increasing from 69.1 years for males and 75.4 years for females born around 1981 to 74.3 years and 79.4 years respectively for those born around 2004. Figure 1.20 also illustrates that improvements in life expectancy at birth are projected to continue, rising to 79.2 years for males and 83.7 years for females by 2031.
Figure 1.20 Period expectation of life at birth1, Scotland, 1981-2031
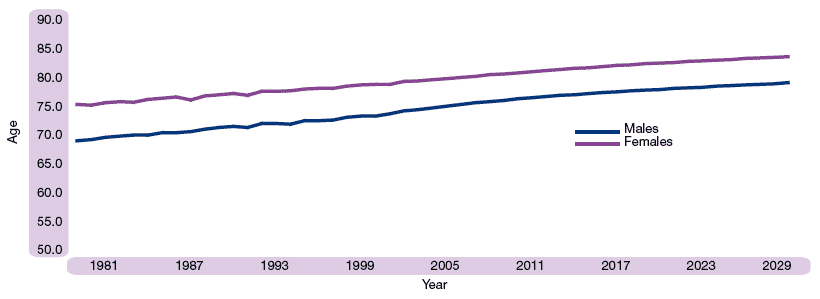
1 2004-based projections.
Data after 2004 are projected.
However, Scottish men and women have almost the lowest expectation of life at birth in the EU (15 states). For Scottish males, expectation of life is almost one year lower than the EU (25 states) average and, for females, it is almost two years lower. For both sexes, the expectation of life is about four years lower than the countries with the highest expectation of life.
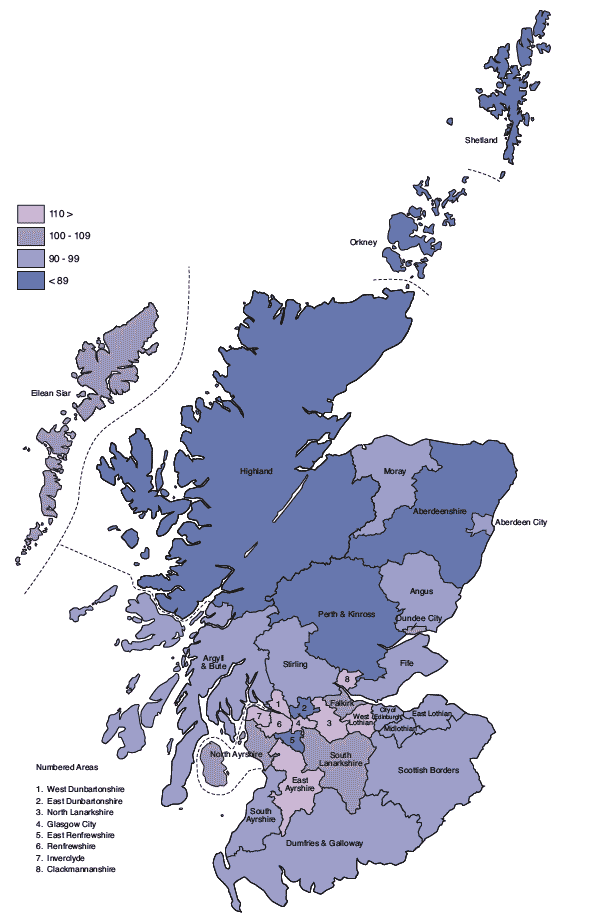
Variations in mortality levels within Scotland
Standardised mortality ratios (SMRs), which compare local death rates with death rates in Scotland as a whole, taking account of the different population structure of each area, are presented in Figure 1.21. Eight of the 32 Council areas have a standardised mortality ratio that is more than 10 per cent higher than the Scottish average of 100. Most of these are in west central Scotland. The worst, Glasgow City, is 24 per cent higher than the Scottish average which itself is about 16 per cent higher than the UK average.
At the other end of the scale, 7 of the 32 Council areas have a standardised mortality ratio that is more than 10 per cent lower than the Scottish average. The lowest was Shetland which was 31 per cent below (or better than) the Scottish average. East Dunbartonshire, East Renfrewshire and Aberdeenshire were respectively 21, 19 and 18 per cent below the Scottish average.
Figure 1.21 Standardised mortality ratios, by Council area, 2005
Cause of death
In 2005, the two most common causes of death in Scotland were cancer (15,135 deaths, 27 per cent) and ischaemic (coronary) heart disease (10,331 deaths, 19 per cent). However, since 1981 the proportion of deaths caused by ischaemic heart disease has fallen from 29 to 19 per cent, whereas the proportion caused by cancer has risen from 22 to 27 per cent. And since 1995, there have been more deaths from cancer than ischaemic heart disease.
Death rates and numbers by sex, for the most common causes of death are shown in Tables 1.2 and 1.3 respectively.
Cancer
Over the last twenty years or so, male death rates from lung cancer have fallen by over a quarter (from 119 per 100,000 population in 1980-82 to 89 in 2005). By contrast, the rates for women, though still considerably lower than those for men, have increased by nearly 70 per cent (from 41 per 100,000 population in 1980-82 to 69 in 2005).
Of the 15,135 deaths from cancers in 2005, trachea, bronchus and lung was the most common type, accounting for over a quarter (26 per cent) of all cancer deaths.
The next most frequent type of cancer death was prostate for men (765 deaths of whom 68 per cent were for people aged 75 and over) and breast for women (1,151 deaths). Death rates for these two causes have been relatively stable in recent years.
Heart disease and stroke
Death rates for ischaemic (coronary) heart disease and cerebrovascular disease (stroke) have shown significant declines. Since 1981, males have experienced slightly larger improvements (44 per cent for ischaemic heart disease and 37 per cent for stroke) compared with improvements of 41 and 34 per cent respectively for females.
Table 1.2 Death rates from selected causes, by sex, Scotland, 1980-2005
Males – rates per 100,000 population
Year |
Cancer |
Ischaemic heart |
Cerebrovascular |
||
|---|---|---|---|---|---|
All sites |
Trachea, bronchus |
Prostate |
|||
1980-82 |
291 |
119 |
19 |
408 |
139 |
1990-92 |
314 |
111 |
27 |
367 |
119 |
2000-02 |
321 |
93 |
32 |
261 |
101 |
2005 |
312 |
89 |
31 |
229 |
87 |
Females – rates per 100,000 population
Year |
Cancer |
Ischaemic heart |
Cerebrovascular |
||
|---|---|---|---|---|---|
All sites |
Trachea, bronchus |
Breast |
|||
1980-82 |
247 |
41 |
45 |
304 |
210 |
1990-92 |
278 |
57 |
48 |
297 |
191 |
2000-02 |
288 |
64 |
43 |
216 |
162 |
2005 |
283 |
69 |
43 |
178 |
139 |
Table 1.3 Number of deaths from selected causes, by sex, Scotland, 1980-2005
Year |
Cancer |
Ischaemic heart disease |
Cerebrovascular disease |
|||
|---|---|---|---|---|---|---|
Males |
Females |
Males |
Females |
Males |
Females |
|
1980-82 |
7,269 |
6,634 |
10,173 |
8,150 |
3,470 |
5,638 |
1990-92 |
7,664 |
7,324 |
8,964 |
7,846 |
2,913 |
5,029 |
2000-02 |
7,674 |
7,394 |
6,342 |
5,664 |
2,465 |
4,250 |
2005 |
7,664 |
7,471 |
5,629 |
4,702 |
2,134 |
3,655 |
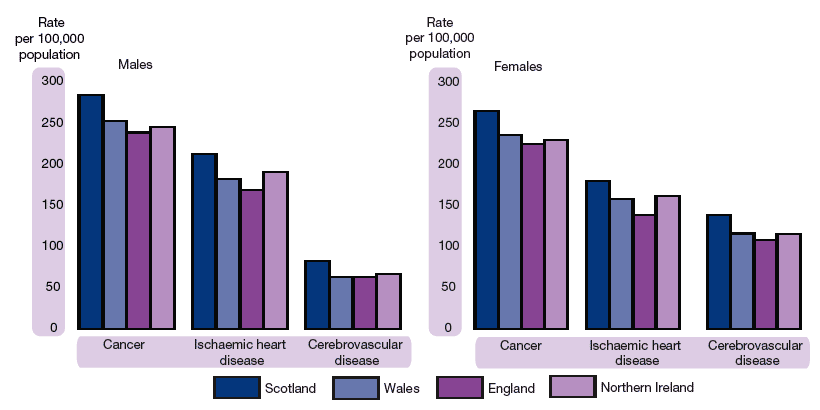
Using 2004 data, the latest available, Figure 1.22 compares the death rates for the constituent countries of the UK for selected causes after adjusting for differences in age structure. The Scottish rates for cancer, ischaemic heart disease, and cerebrovascular disease (strokes) are well above the rates for the other countries of the United Kingdom for both men and women.
Figure 1.22 Age-adjusted mortality rates, by selected cause and sex, 2004
Suicides
In 2005, deaths from intentional self-harm numbered 547 (393 males and 154 females), 59 fewer than in 2004. To allow for any under-recording of suicides, it is conventional to combine deaths classified as ‘events of undetermined intent’ with those for ‘intentional self-harm’, as most of the former are believed to be suicides. The total number of deaths classified to these two groups in 2005 was 763 compared with 835 in 2004 and 794 in 2003.
Suicide is the most common cause of death for men aged 15-44 and women aged 15-34. For men the most frequent cause of these deaths was hanging, strangulation and suffocation, whereas for women it was poisoning.
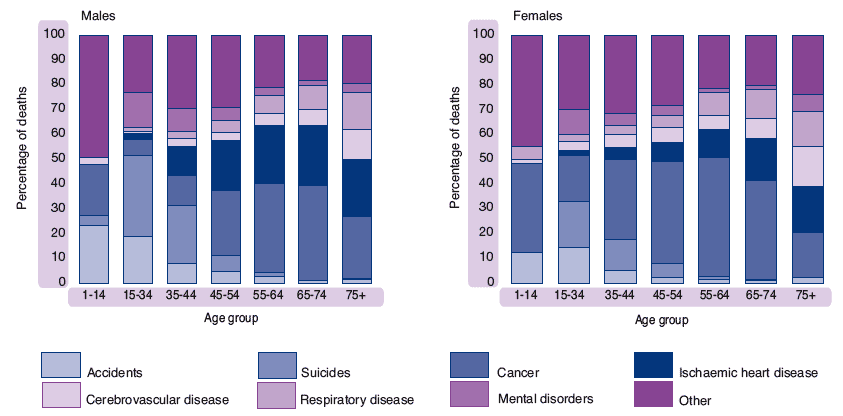
Main causes of death by age and sex
The main causes of death vary in frequency by age and sex (Figure 1.23). Diseases of the nervous system were the largest single cause amongst boys aged 1-14, closely followed by cancer and accidents. For girls aged 1-14, cancer was the most common cause with accidents and diseases of the nervous system ranking second equal.
For males aged 15-34, the main cause was suicide (intentional self-harm plus undetermined deaths) followed by accidents and mental disorders (almost entirely associated with drug and alcohol abuse). For females in this age group, suicide was also the largest category. Cancer and accidents respectively were the next most common causes.
Suicide was also the most frequent cause of death for males aged 35-44; cancer was second, followed by ischaemic heart disease. For women aged 35-44, cancer was the main cause followed by suicide.
For both sexes and all age groups between 45 and 74, cancer was the main cause followed by ischaemic heart disease. For women, cancer was responsible for a higher proportion of deaths in these age groups than for men. Conversely, ischaemic heart disease accounted for a higher proportion of deaths in these age groups for men than for women.
Figure 1.23 Deaths, by cause and age group, Scotland, 2005
Unlike births and deaths, there is no comprehensive source for estimating migration and hence it is the most difficult component of population change to measure and predict. Migration and the reasons for migrating are also much more susceptible to short-term changes in social and economic circumstances than births and deaths.
There has been an increased interest in migration in recent years because population projections have highlighted the long-term decline and ageing of Scotland’s population. The Scottish Executive’s Fresh Talent initiative aims to stem population decline, and alleviate possible problems of a reduced workforce, by attracting young and economically active people to Scotland, and by encouraging others to stay.
The Registrar General’s Annual Report for 2003 includes a full analysis of migration data for Scotland. This included analysis of Census 2001 information and gave an overview of data used in the population estimates for Scotland. A further analysis of Census 2001 data on migration was published on 25 January 2005: http://www.nrscotland.gov.uk/statistics-and-data/statistics/statistics-by-theme/migration/scotlands-census-2001-statistics-on-migration.
Trends in migration since 1951
Historically, Scotland has been a country of net out-migration with more people leaving Scotland to live elsewhere than moving to live in Scotland. However, since the 1960s net out-migration has greatly reduced. Indeed, in some years during the late 1980s and early 1990s, Scotland experienced net migration gains. This has also been the case in the last three years, with net gains of around 9,000 in the year to mid-2003, 26,000 to mid-2004 (the highest level recorded since current records started in 1952) and 19,000 to mid-2005, as can be seen from Figure 1.24.
Figure 1.24 Estimated net migration, Scotland, 1951-2005
Source: National Health Service Central Register (NHSCR) patient movements.
Net migration is the difference between much larger gross flows of migrants into and out of Scotland. In the last four years these have typically been about 70,000 to 90,000 in each direction. The level of net migration can be significantly affected by relatively small changes in these gross flows from year to year, particularly if one flow rises while the other falls. In the year to 30 June 2005, around 57,300 people came to Scotland from England, Wales and Northern Ireland and around 44,800 people left Scotland to go in the opposite direction. The net inflow of around 12,500 is lower than the previous year’s highest-ever 15,500 net inflow, because fewer people came to Scotland and only slightly fewer people left than in the previous year.
About 35,400 people (including some asylum seekers) came from overseas and around 28,100 left Scotland to go overseas, giving a net migration gain of around 7,300, which is lower than the previous year’s record net inflow of 11,700. Estimating international migration is particularly difficult as the estimate is based primarily on the International Passenger Survey (IPS). This is a sample survey conducted at main airports and ports across the UK, and the sample size for Scotland is very small (around 100 contacts in 2004). Internationally, a migrant is defined as someone who changes their country of usual residence for 12 months or more. So short-term seasonal migrant workers, including many from the Eastern European states which joined the EU in 2004, will not be counted in the migration estimates, and hence will not be counted in the mid-year population estimates. The Office for National Statistics (ONS) is currently leading work into ways of quantifying short-term migrants.
Origins and destinations of UK migrants
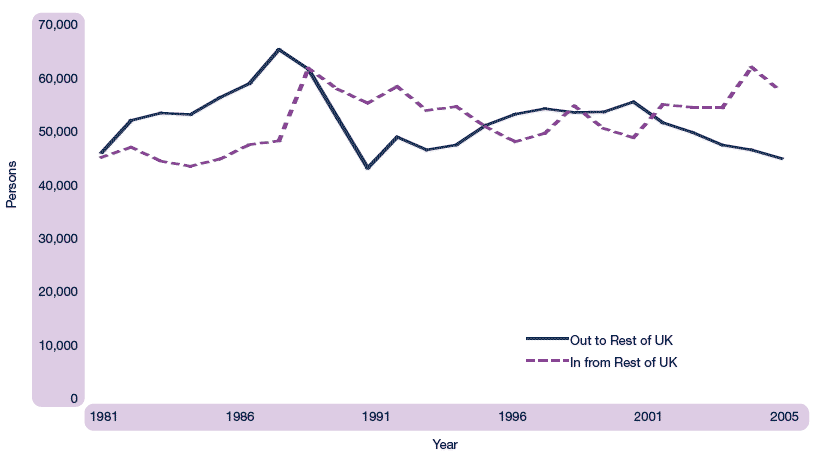
Figure 1.25 illustrates the trend in flows of people to and from the rest of the UK since 1981. The UK flows have been fairly constant with some fluctuations at about 50,000 in either direction.
Figure 1.25 Movements to/from the rest of the UK, 1981 to 2005
Source: National Health Service Central Register (NHSCR) patient movements.
Table 1.4 shows that in the year to mid-2005, around 21 per cent of people coming to Scotland from the rest of the UK went to the Lothian NHS Board area, 13 per cent to Greater Glasgow, 12 per cent to Grampian and 8 per cent to Tayside. Similarly 22 per cent of people leaving Scotland to go to the rest of the UK were from Lothian, 18 per cent from Greater Glasgow and 11 per cent from Grampian. The NHS Board areas with the highest net gains were Highland, Grampian and Lothian, all with net inflows of around 2,000.
Table 1.4 Movements between Scotland and the rest of the UK by NHS Board area, mid-2004 to mid-2005
|
Rest of UK |
% of |
Rest of UK |
% of |
Net |
|---|---|---|---|---|---|
Argyll & Clyde |
3,564 |
6 |
3,030 |
7 |
534 |
Ayrshire & Arran |
2,990 |
5 |
2,574 |
6 |
416 |
Borders |
1,833 |
3 |
1,211 |
3 |
622 |
Dumfries & Galloway |
3,144 |
5 |
1,675 |
4 |
1,469 |
Fife |
3,873 |
7 |
2,969 |
7 |
904 |
Forth Valley |
2,598 |
5 |
1,975 |
4 |
623 |
Grampian |
6,959 |
12 |
4,900 |
11 |
2,059 |
Greater Glasgow |
7,557 |
13 |
7,864 |
18 |
-307 |
Highland |
4,197 |
7 |
2,081 |
5 |
2,116 |
Lanarkshire |
3,015 |
5 |
2,691 |
6 |
324 |
Lothian |
11,803 |
21 |
9,994 |
22 |
1,809 |
Orkney Islands |
370 |
1 |
195 |
0 |
175 |
Shetland Islands |
371 |
1 |
228 |
1 |
143 |
Tayside |
4,605 |
8 |
3,194 |
7 |
1,411 |
Western Isles |
463 |
1 |
254 |
1 |
209 |
Scotland Total |
57,342 |
100 |
44,835 |
100 |
12,507 |
People coming to Scotland from the rest of the UK came mainly from England (93 per cent). Fifteen per cent came from each of the North West, the North East and the South East, 14 per cent from London, 10 per cent from Yorkshire and the Humber, 9 per cent from the East, 8 per cent from the South West and 7 per cent from the East Midlands and the West Midlands. There were fairly similar proportions of people going to the areas of England from Scotland. For example, about 15 per cent went to the South East, 15 per cent to the North West and 16 per cent to London.
Age and sex of migrants
The age and sex of migrants remains relatively constant from year to year. Figure 1.26 illustrates the age/sex distribution of migrants for males and females moving between Scotland and the rest of the UK between 2004 and 2005. The peak ages for migrating are the late teens to mid-twenties reflecting moves out of the parental home for higher education or employment. There also tend to be smaller peaks for moves of the very young, under the age of five, as their parents move home before their children have started school. The pattern of migration is very similar for men and women, though more women than men tend to migrate in their early twenties. However, this may reflect different patterns of re-registering with an NHS doctor after a move (the main data source for migration estimates) rather than different patterns of migration.
Figure 1.26 Movements between Scotland and the rest of the UK, by age, mid-2004 to mid-2005
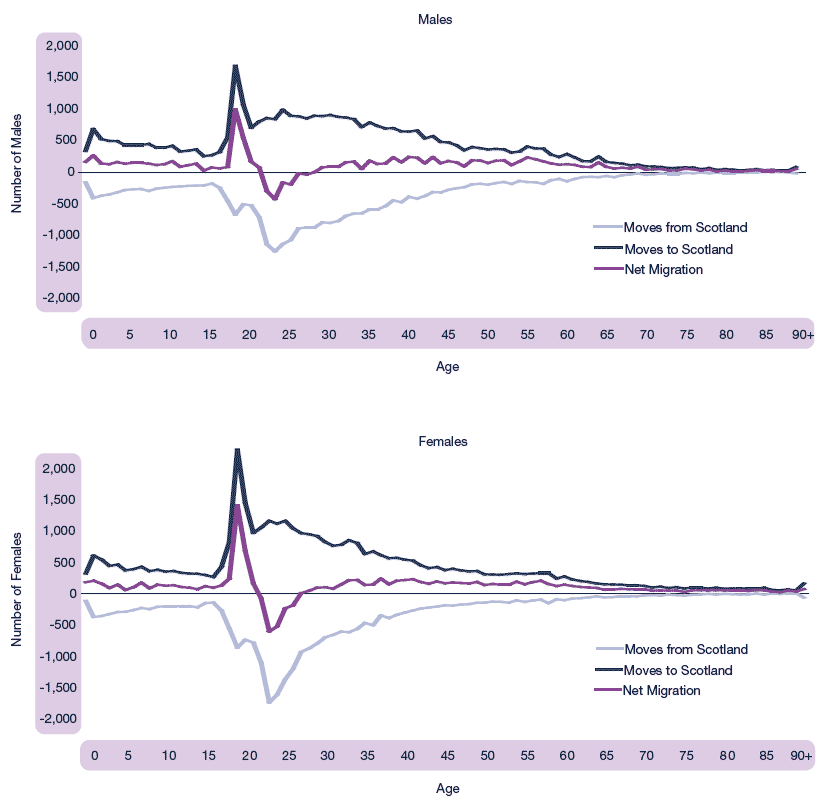
The peaks in migration for males and females in their late teens and early twenties create marked net migration gains at ages 19 and 20, and net migration losses at ages 23 and 24. These patterns are consistent with an influx of students from outside Scotland starting higher education, followed by a further move after graduation. Later in life, there is no significant ‘retirement migration’ in either direction.
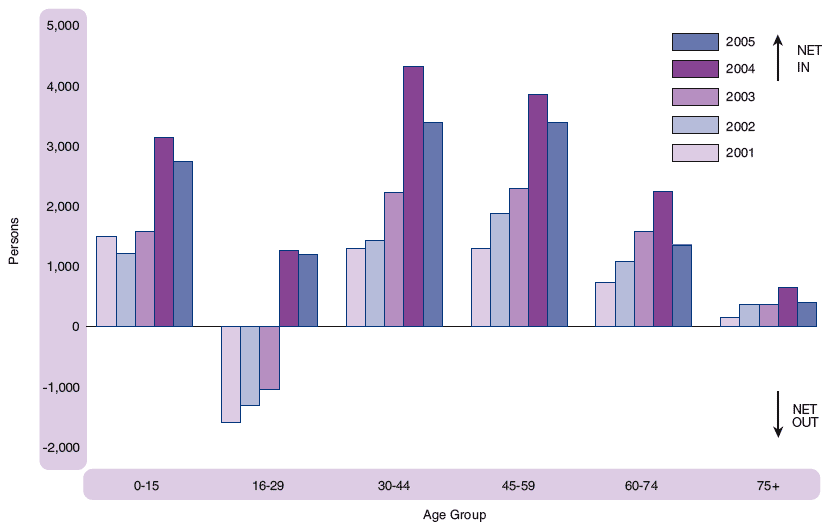
Figure 1.27 shows that, in the year to mid-2005, Scotland gained people of all age groups from the rest of the UK. The figures for previous years show that movement of all age groups into Scotland has increased. The figures for the latest year are lower than in mid-2004 for all age groups, albeit not by much for the 16-29 age group.
Figure 1.27 Net movements between Scotland and the rest of the UK by age group1, 2001-2005
1 The age and sex distribution of people moving to Northern Ireland from Scotland, was assumed.
Source: National Health Service Central Register (NHSCR) patient movements.
Table 1.5 shows movements to/from the UK and overseas between mid-2004 and mid-2005 by age group.
Migrants tend to be much younger than the general population with between 46 per cent (rest of the UK) and 69 per cent (overseas) of in-migrants aged 16-34 compared with 24 per cent of the resident population. No significant retirement migration is evident, as only 5 per cent of people coming to Scotland from the rest of the UK were aged 65 and over, as were an assumed 1 per cent of overseas migrants.
Table 1.5 Rest of UK/Overseas moves by age group: 2004-2005
Numbers |
||||||||||
|---|---|---|---|---|---|---|---|---|---|---|
Movements between Scotland and the rest of the UK1 |
||||||||||
|
0-15 |
16-24 |
25-34 |
35-44 |
45-54 |
55-64 |
65-74 |
75-84 |
85+ |
All ages |
IN |
9,656 |
12,796 |
13,704 |
9,083 |
5,376 |
3,933 |
1,622 |
780 |
392 |
57,342 |
OUT |
6,909 |
10,894 |
13,504 |
6,575 |
3,186 |
2,044 |
954 |
508 |
261 |
44,835 |
NET |
2,747 |
1,902 |
200 |
2,508 |
2,190 |
1,889 |
668 |
272 |
131 |
12,507 |
Movements between Scotland and Overseas (including asylum seekers, excluding unmeasured migration adjustment)2 |
||||||||||
IN |
4,836 |
12,412 |
11,943 |
3,553 |
1,455 |
736 |
329 |
107 |
29 |
35,400 |
OUT |
4,329 |
6,829 |
8,464 |
4,121 |
1,997 |
1,280 |
598 |
318 |
164 |
28,100 |
NET |
507 |
5,583 |
3,479 |
-568 |
-542 |
-544 |
-269 |
-211 |
-135 |
7,300 |
Total net migration (including asylum seekers, rounding and unmeasured migration adjustments)3 |
||||||||||
NET |
3,245 |
6,973 |
3,607 |
2,144 |
1,710 |
1,304 |
338 |
4 |
-29 |
19,296 |
Percentages |
||||||||||
Movements between Scotland and the rest of the UK1 |
||||||||||
IN |
17 |
22 |
24 |
16 |
9 |
7 |
3 |
1 |
1 |
100 |
OUT |
15 |
24 |
30 |
15 |
7 |
5 |
2 |
1 |
1 |
100 |
Movements between Scotland and Overseas (including asylum seekers, excluding unmeasured migration adjustment)2 |
||||||||||
IN |
14 |
35 |
34 |
10 |
4 |
2 |
1 |
0 |
0 |
100 |
OUT |
15 |
24 |
30 |
15 |
7 |
5 |
2 |
1 |
1 |
100 |
1 National Health Service Central Register (NHSCR) patient movements mid-2004 to mid-2005.
2 Totals are based primarily on International Passenger Survey (IPS) data. However, the sample size in Scotland is too small to give an age breakdown so an age distribution is assumed using NHSCR data.
3 Note that the movements between Scotland and the rest of the UK and overseas will not sum to the total net migration as they exclude unmeasured migration and rounding adjustments.
Migration and the distribution of people in Scotland
In many parts of Scotland, migration is the most important component of population change. Net migration rates (here, the amount of net migration between 1995 and 2005 as a proportion of the 1995 population) are a useful indicator when comparing migration between areas of different sizes. Information on net rates for Council areas is shown in Figure 1.28.
Figure 1.28 Net migration rates for Council areas, 1995 to 2005
The patterns of migration over the period 1995 to 2005 indicate the highest net out-migration rates were in Aberdeen City, Shetland Islands and Dundee City. The highest net in-migration rates were in East Lothian, West Lothian and Scottish Borders.
Numbers
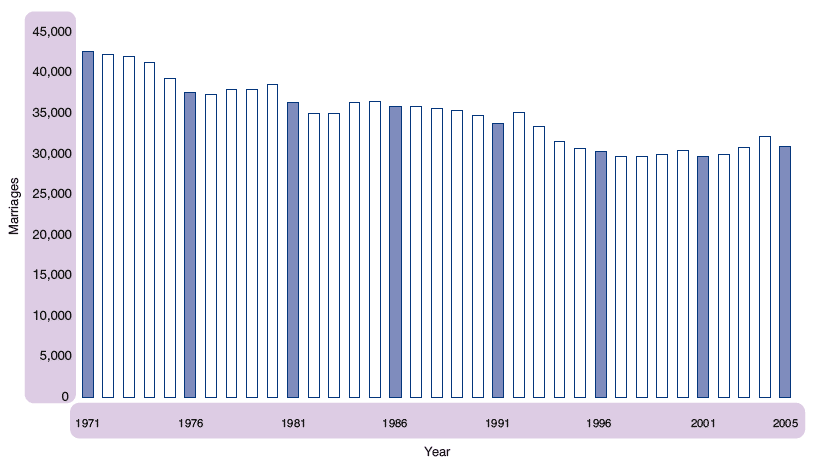
There were 30,881 marriages in Scotland in 2005, 1,273 (4.0 per cent) fewer than in 2004, which had the highest total since 1993. Figure 1.29 shows that, following a decline from over 40,000 marriages a year in the early 1970s, the annual total has levelled out at around 30,000.
The information in this section covers all marriages registered in Scotland, regardless of the usual residence of the parties involved. Recent years have seen a general increase in the number of marriages where neither the bride nor groom was resident in Scotland, though there was a fall in this category from 9,710 in 2004 to 8,817 in 2005 – nearly half of which were at Gretna. Of course, many couples who are resident in Scotland go abroad to be married. These marriages are not included, and only some come to the attention of the Registrar General through notification to British consular authorities.
Figure 1.29 Marriages, Scotland, 1971-2005
Marital status at marriage
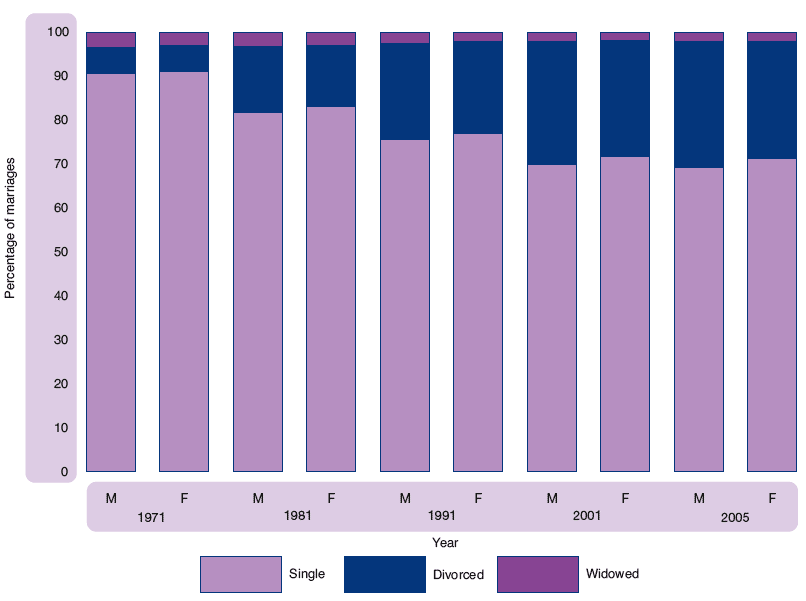
Figure 1.30 shows the percentage of marriages by marital status at the time of marriage between 1971 and 2005. The percentage of people marrying who had been divorced rose from just under 6 per cent in 1971, to over a quarter in 2005 (28 per cent for males and 27 per cent for females). The majority of this shift reflects a reduction in the proportion of marriages where one of the partners had never been married. However, the proportion of those marrying who were widowed has also declined slightly – in 2005, the proportion was about 2 per cent whereas it was just over 3 per cent in 1971.
Figure 1.30 Marriages, by marital status of persons marrying, 1971-2005
Marriages by type of ceremony
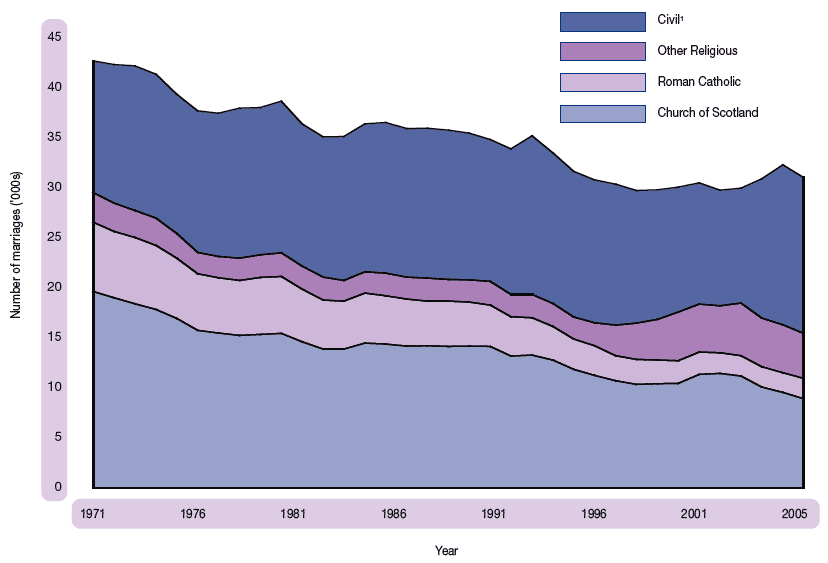
Civil marriages accounted for half of all marriages in 2005 compared to around one-third in 1971 (Figure 1.31). The trend mainly reflects a decline in the number of religious ceremonies during the 1970s, 1980s and early 1990s. The small increase in religious marriages observed during the period 1997-2002 was largely associated with the increase of ‘tourism’ marriages, of which a significant proportion were carried out at Gretna.
Figure 1.31 Marriages, by type of ceremony, 1971-2005
1 Includes irregular marriages
Until 2002, civil marriages could only be held in registration offices. The Marriage (Scotland) Act 2002 allowed registrars to conduct ceremonies in other approved places, from June 2002. Over 600 venues have now been approved, including castles, hotels, clubs and a small number of outdoor venues in gardens or the countryside.
During 2005, 7,055 civil ceremonies (23 per cent of all marriages and 45 per cent of civil marriages) were conducted at these ‘approved places’. This represented an increase of 18 per cent on 2004 and an increase of 104 per cent on 2003, the first full year of the new arrangements. There has been a corresponding decrease in the number of religious marriages, from 18,371 in 2002 to 15,368 in 2005.
Just over half of the 15,368 religious marriages were celebrated in places of worship and most civil marriages in registration offices (8,455 or 55 per cent). Hotels were the venue for about 2,600 religious and 3,100 civil ceremonies, while approximately 1,200 religious and 600 civil marriages took place in castles and other historic buildings and 58 religious and 25 civil marriages were held on ships and barges.
Numbers
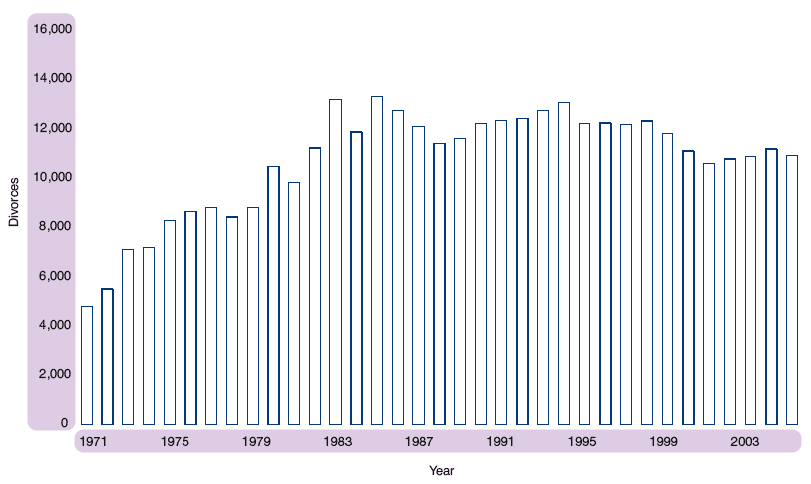
The number of divorces in 2005 was 10,940, some 287 fewer than in 2004. Figure 1.32 shows the number of divorces between 1971 and 2005. There was a marked increase in the number of divorces up to a peak of over 13,373 in 1985. Recent years have seen a slight fall from the levels recorded in the late 1980s and 1990s. It is probable that increasing cohabitation may be relevant to the recent decline in divorces, since divorce proceedings are not necessary to sever such relationships.
The information in this report relates to divorces granted under the Divorce (Scotland) Act 1976 and covers divorces granted in Scotland, regardless of where the marriage took place.
Figure 1.32 Divorces, Scotland, 1971-2005
Grounds for divorce
Figure 1.33 shows the trend in grounds for divorce between 1981 and 2005. The Divorce (Scotland) Act 1976 introduced new grounds for divorce – principally non-cohabitation, meaning that couples separated for two years (with consent) or five years (without consent) could file for divorce on that ground.
Figure 1.33 Number of divorces, by grounds for divorce, Scotland, 1981-2005
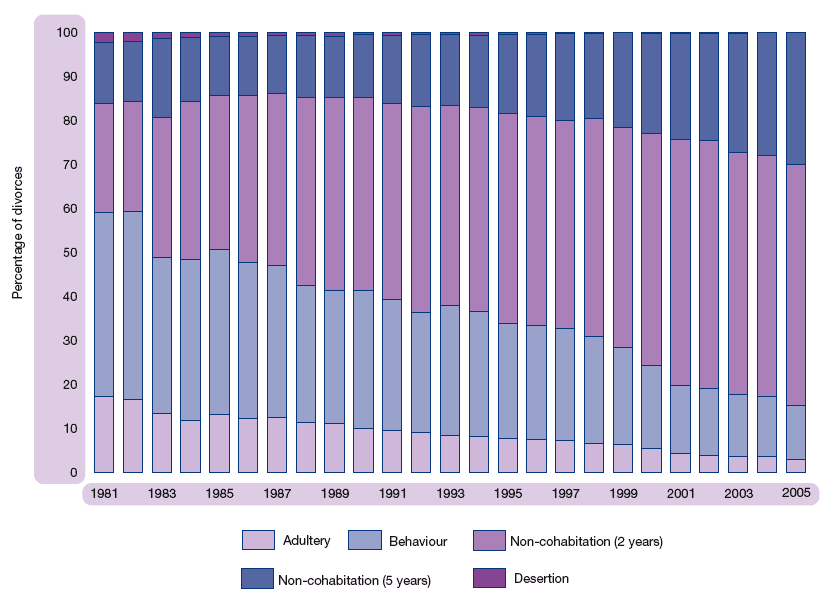
In 2005, non-cohabitation was the most frequent reason for divorce, accounting for 85 per cent of all divorces. Non-cohabitation (two years and consent) increased from 25 per cent of all divorces in 1981 to 55 per cent of all divorces in 2005; non-cohabitation (five years) increased from 14 per cent to 30 per cent; and adultery as the stated reason for divorce fell from 17 per cent to 3 per cent.
Divorces by marital status
Of those divorcing in 2005, 16 per cent of both men and women had divorced previously. This compares with 8 per cent for men and 7 per cent for women in 1981. This is consistent with the increase in the proportion of all marriages where one or both participants was divorced previously (now 2 in 5 marriages compared with 1 in 4 twenty years ago).
Duration of marriages that ended in divorce
In 2005, the median duration of marriage ending in divorce was 15 years, whereas the comparable duration for 1981 was 9 years. In part, this increase will reflect the changing balance between cohabiting relationships and marriage.
Divorce by age at marriage
In 2005, 26 per cent of all divorces involved couples where at least one of the partners was aged 20 or under when they married. This is a significant fall from 60 per cent in 1981, but not unexpected given that the proportion of marriages where at least one of the partners was aged 20 or under has fallen from 36 per cent in 1981 to 3 per cent in 2005.
The Civil Partnership Act 2004, which applies throughout the UK, came into force on 5 December 2005, allowing same-sex couples to register their partnership. In Scotland, the first civil partnership was registered on 20 December 2005 and by the end of the year a total of 84 had been registered – 53 male couples and 31 female couples.
The Registrar General recorded 439 adoptions during 2005 – 46 more than in 2004, but just over half the number recorded in the early 1990s and around a quarter of the number recorded in the early 1970s.
Some 33 per cent of the children adopted in 2005 were adopted by a step-parent and 64 per cent were adopted by non-relatives of the child. Only 16 per cent of children adopted in 2005 were aged under 2, nearly all being adopted by non-relatives. By contrast, only 22 per cent of the 104 adoptions of children aged 10 or over were by non-relatives.
The Gender Recognition Act 2004 came into force on 4 April 2005. The Act applies throughout the UK and enables transsexual people to apply to the Gender Recognition Panel to obtain a Gender Recognition Certificate. Successful applicants are considered from the date of issue of the Certificate to be legally of their acquired gender. A holder of a Gender Recognition Certificate is able to enjoy all the rights appropriate to a person of his or her acquired gender, including obtaining a new birth certificate showing his or her recognised legal gender.
The Registrar General has set up a Gender Recognition Register in which the birth of a transsexual person whose acquired gender has been legally recognised is registered showing any new name(s) and the acquired gender. This enables the transsexual person to apply to the Registrar General for a new birth certificate showing the new name(s) and the acquired gender. In 2005, there were 47 entries in the Gender Recognition Register. The Gender Recognition Register is not open to public scrutiny.
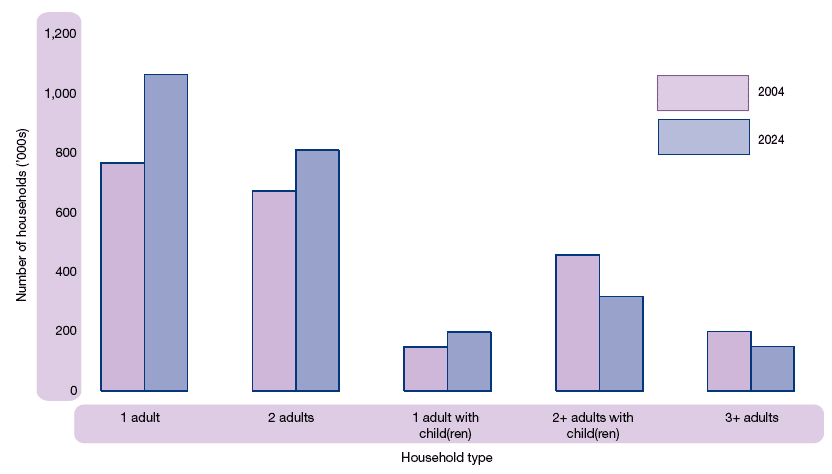
In contrast to the long-term projected decline in Scotland’s population, the latest projections of the number of households show an increase. This is mainly due to the population ageing, and more people living alone, or in smaller households – the average household size is projected to drop from 2.22 people in 2004, to just under 2 by 2024. This is a continuation of the long-running decline in average household size – in 1971, the average household contained around 3 people. Between 2004 and 2024, the number of households is projected to increase by 13 per cent to 2.5 million – an average of 14,800 additional households per year.
Household type
Figure 1.34 shows the projected number of households of each type, in 2004 and 2024. There is a large projected increase in the number of adults living alone, from 770,000 (34 per cent of all households) in 2004 to over a million (42 per cent) by 2024. There are also increases in other small households – households containing just two adults without children are projected to rise from 670,000 to 810,000, and the number of households containing one adult with children is projected to rise from 150,000 to 200,000.
In contrast, the number of larger households is projected to fall, with households containing two or more adults with children decreasing from 460,000 (20 per cent of all households) in 2004 to 320,000 (12 per cent) by 2024. There is also a projected decrease in the number of households containing three or more adults, from 200,000 to 150,000 over the same period.
Figure 1.34 Projected households in Scotland by household type: 2004 and 2024
Age of head of household
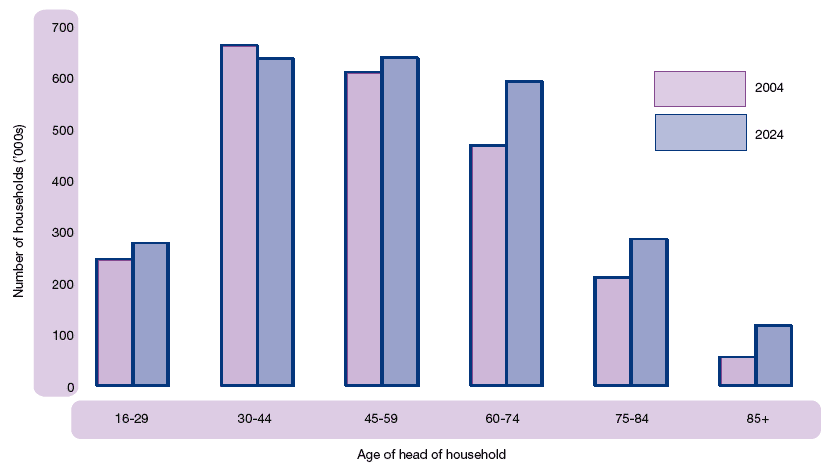
Figure 1.35 shows the projected number of households in 2004 and 2024, by the age of the head of household. The population projections show that Scotland’s population is ageing, with a projected increase in the number of people in the older age groups and fewer people in the younger age groups. This trend is reflected in the household projections, with the largest increases shown in households headed by people aged 60 or over (an increase of over a third between 2004 and 2024, from 730,000 to 990,000). In contrast, households headed by someone aged under 60 are projected to increase by just 2 per cent, to around 1.5 million. The number of households headed by someone aged 85 or over is projected to more than double over this period, from 56,000 to 117,000.
Figure 1.35 Projected households in Scotland by age of head of household: 2004 and 2024
Variations within Scotland
The number of households in almost every local authority area is projected to increase. Figure 1.36 shows the projected percentage change in the number of households between 2004 and 2024.
The largest projected increase between 2004 and 2024 is in West Lothian (34 per cent). Edinburgh, the Scottish Borders, East Lothian, Aberdeenshire and Fife all have projected increases of between 21 and 23 per cent. Aberdeen City has a projected decrease of 11 per cent over the same period, and Dundee City has a projected decrease of 6 per cent. In general, the city areas have the highest proportion of people living alone, and the lowest proportion of households containing two or more adults with children.
Figure 1.36 Projected change in households by Council area, 2004-2024