Unlike some countries, the UK does not have a comprehensive system of recording migrants, particularly those leaving the country, nor any legal requirement to notify change of address. So migration is the most difficult component of population change to measure and predict. Migration and the reasons for migrating are also much more susceptible to short-term changes in social and economic circumstances than births and deaths. The Registrar General’s Annual Report for 2003 includes a full analysis of migration data for Scotland. This included analysis of Census 2001 information and gave an overview of data used in the population estimates for Scotland. More detailed information on migration methodology is available on our website at: http://www.nrscotland.gov.uk/statistics-and-data/statistics/statistics-by-theme/migration/methodology
Trends in migration since 1951
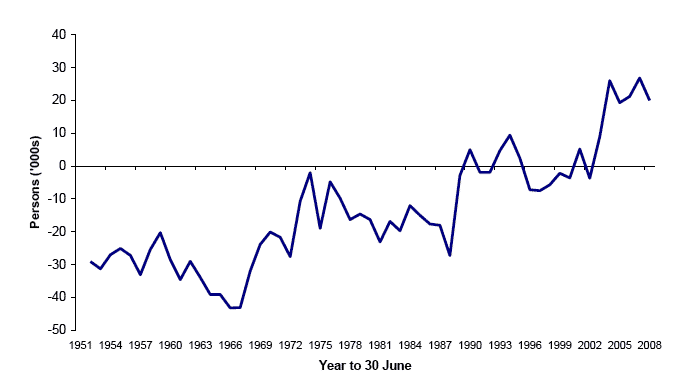
Historically, Scotland has been a country of net out-migration, with more people leaving Scotland to live elsewhere than moving to live in Scotland. However, since the 1960s, net out-migration has greatly reduced and in some years during the late 1980s and early 1990s Scotland experienced net migration gains. This has also been the case in the last six years, with net gains of around 9,000 to mid-2003, 26,000 to mid-2004, 19,000 to mid-2005, 21,000 to mid-2006, 27,000 to mid-2007 and 20,000 to mid-2008. The net migration gain in 2006-07 was the highest since current records started in 1951; the 2007-08 total was the fourth highest. This can be seen in Figure 4.1.
Figure 4.1 Estimated net migration, Scotland, 1951-2008
Net migration is the difference between much larger flows of migrants into and out of Scotland. The level of net migration can be significantly affected by relatively small changes in these gross flows from year to year, particularly if one flow rises while the other falls. In the last five years, migration into Scotland has typically been about 90,000 to 100,000 per year whilst migration from Scotland has ranged from around 65,000 to around 75,000.
In the year to 30 June 2008, around 53,300 people came to Scotland from England, Wales and Northern Ireland and around 41,800 people left Scotland for the rest of the UK. The net gain of around 11,500 is higher than the previous year’s net gain of 8,800.
During the same period, about 38,500 people came to Scotland from overseas and around 30,800 left Scotland to go overseas, giving a net migration gain from overseas of around 7,700. This compares to record net gains over each of the last two years of 12,700 in the year to June 2006 and 16,800 in the year to June 2007. Estimating international migration is particularly difficult as the estimate is based primarily on the International Passenger Survey (IPS). This is a sample survey conducted at main airports and ports across the UK, and the sample size for Scotland is very small (around 210 migrant contacts in 2007-08). Internationally, migrants are defined as people who change their country of usual residence for 12 months or more. So short-term seasonal migrant workers, including many from the Eastern European states which joined the EU in 2004, will not be counted in the migration estimates, and hence will not be included in the mid-year population estimates.
Origins and destinations of migrants
Figure 4.2 illustrates the trend in flows of people to and from the rest of the UK since 1981. This year saw the first rise in in-migration since the peak in 2004, whilst the downward trend in out-migration has continued.
Figure 4.2 Movements to/from the rest of the UK, 1981 to 2008
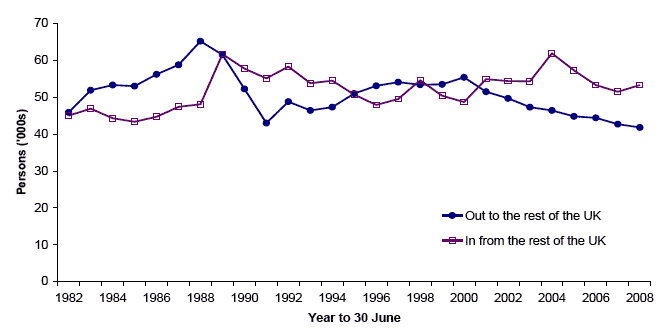
Figure 4.3 shows the trends in flows of people to and from overseas since 1991.
In-migration from overseas has been increasing since 2002 and is currently at its highest level since the series began in 1991. Out-migration to overseas has returned to the level recorded two years ago, following low out-migration last year. The figures shown here are from the Total International Migration (TIM) series produced by the Office of National Statistics (ONS). The TIM figures have been used to estimate overseas migration to and from Scotland for only the last two years, so GROS estimates for international migration from earlier years may not match those presented here.
Figure 4.3 Movements to/from overseas, 1991 to 2008
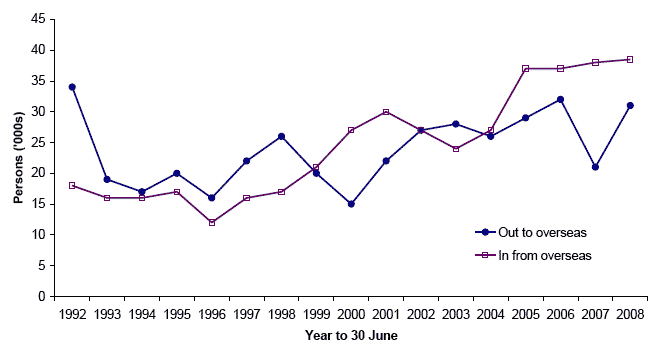
Source: ONS Total International Migration.
Table 4.1 shows that 93 per cent of people coming to Scotland from the rest of the UK came from England. The biggest in flows were of people from the North West, the South East and London. In flows from Wales and Northern Ireland accounted for four and three percent of the total respectively. The proportions of people going to Wales, Northern Ireland and the areas of England from Scotland were similar to those coming from those areas. Scotland gained migrants from every part of the UK except Northern Ireland.
Table 4.1 Movements between Scotland and the rest of the UK by Country and Region, mid-2007 to mid-2008
Rest of UK inflow 2007-08 |
% of inflow |
Rest of UK outflow 2007-08 |
% of outflow |
Net |
|
|---|---|---|---|---|---|
England |
49,596 |
93 |
37,992 |
91 |
11,604 |
North East |
4,452 |
8 |
3,450 |
8 |
1,002 |
North West |
8,085 |
15 |
5,893 |
14 |
2,192 |
Yorkshire and the Humber |
5,451 |
10 |
3,966 |
9 |
1,485 |
East Midlands |
3,687 |
7 |
2,624 |
6 |
1,063 |
West Midlands |
3,650 |
7 |
2,650 |
6 |
1,000 |
East |
4,736 |
9 |
3,405 |
8 |
1,331 |
London |
7,496 |
14 |
6,414 |
15 |
1,082 |
South East |
7,806 |
15 |
5,880 |
14 |
1,926 |
South West |
4,233 |
8 |
3,710 |
9 |
523 |
Wales |
1,909 |
4 |
1,491 |
4 |
418 |
Northern Ireland |
1,822 |
3 |
2,335 |
6 |
-513 |
Total |
53,327 |
100 |
41,818 |
100 |
11,509 |
Age and sex of migrants
Figure 4.4 illustrates the age distribution for people moving between Scotland and the rest of the UK between mid-2007 and mid-2008. The peak age for migration into Scotland is 19, at which age there is a marked migration gain. The peak ages for migrating out of Scotland on the other hand are 23 and 24 and this results in a migration loss at these ages. This results from an influx of students from outside Scotland starting higher education, followed by a further move after graduation.
Figure 4.4 Movements between Scotland and the rest of the UK, by age, mid-2007 to mid-2008
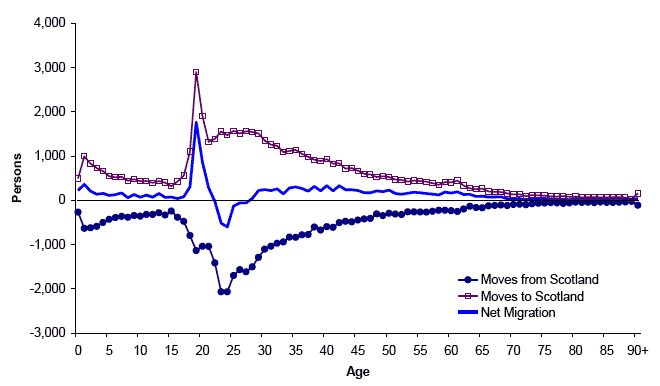
Figure 4.5 shows the age distribution for people moving between Scotland and overseas between mid-2007 and mid-2008. In contrast to moves to Scotland from the rest of the UK, the peak age for migration into Scotland is 23 and there are high numbers of migrants from age 19 to 30. This results in a net migration gain of young adults through to age 35.
Figure 4.5 Movements between Scotland and overseas, by age, mid-2007 to mid-2008
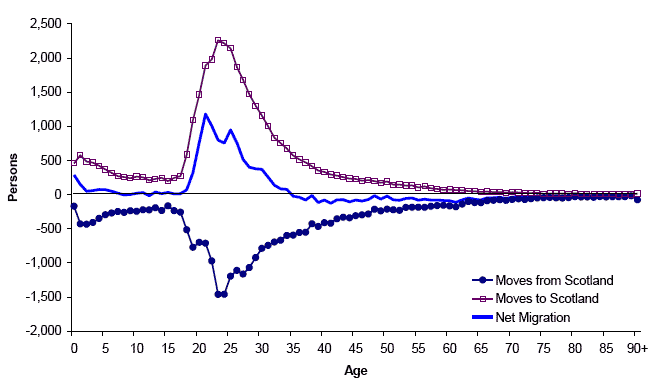
For both rest of the UK and overseas moves, there also tend to be smaller peaks for moves of the very young, under the age of 5, as their parents move home before their children have started school. Later in life, there is no significant "retirement migration" in either direction. The pattern of migration is very similar for men and women.
Table 4.2 shows movements to/from the UK and overseas between mid-2007 and mid-2008 by age group. Migrants tend to be much younger than the general population: 48 per cent of in-migrants from the rest of the UK and 68 per cent of those from overseas are aged 16-34, compared with 24 per cent of the resident population. Only 6 per cent of people coming to Scotland from the rest of the UK were aged 65 and over, as were an estimated 1 per cent of overseas migrants. Scotland had a net gain of UK migrants in every age-group and international migrants at every age-group to 35.
Table 4.2 Rest of UK/Overseas moves by age group: 2007-2008
Numbers |
||||||||||
|---|---|---|---|---|---|---|---|---|---|---|
Movements between Scotland and the rest of the UK1 |
||||||||||
|
0-15 |
16-24 |
25-34 |
35-44 |
45-54 |
55-64 |
65-74 |
75-84 |
85+ |
All ages |
IN |
8,110 |
12,203 |
13,092 |
8,429 |
5,049 |
3,640 |
1,563 |
800 |
441 |
53,327 |
OUT |
6,089 |
9,807 |
12,274 |
6,153 |
3,330 |
2,210 |
1,082 |
550 |
323 |
41,818 |
NET |
2,021 |
2,396 |
818 |
2,276 |
1,719 |
1,430 |
481 |
250 |
118 |
11,509 |
Movements between Scotland and Overseas (including asylum seekers, excluding unmeasured migration adjustment)2 |
||||||||||
|
0-15 |
16-24 |
25-34 |
35-44 |
45-54 |
55-64 |
65-74 |
75-84 |
85+ |
All ages |
IN |
5,564 |
12,534 |
13,356 |
3,901 |
1,826 |
794 |
342 |
141 |
42 |
38,500 |
OUT |
4,426 |
7,198 |
9,209 |
4,579 |
2,419 |
1,571 |
772 |
401 |
225 |
30,800 |
NET |
1,138 |
5,336 |
4,147 |
-678 |
-593 |
-777 |
-430 |
-260 |
-183 |
7,700 |
Total net migration (including asylum seekers, movements to and from the armed forces and rounding adjustments)3 |
||||||||||
|
0-15 |
16-24 |
25-34 |
35-44 |
45-54 |
55-64 |
65-74 |
75-84 |
85+ |
All ages |
NET |
3,332 |
7,507 |
5,283 |
1,944 |
1,215 |
681 |
58 |
-9 |
-58 |
19,953 |
Percentages |
||||||||||
Movements between Scotland and the rest of the UK1 |
||||||||||
|
0-15 |
16-24 |
25-34 |
35-44 |
45-54 |
55-64 |
65-74 |
75-84 |
85+ |
All ages |
IN |
15 |
23 |
25 |
16 |
9 |
7 |
3 |
2 |
1 |
100 |
OUT |
15 |
23 |
29 |
15 |
8 |
5 |
3 |
1 |
1 |
100 |
Movements between Scotland and Overseas (including asylum seekers and movements to and from armed forces)2 |
||||||||||
|
0-15 |
16-24 |
25-34 |
35-44 |
45-54 |
55-64 |
65-74 |
75-84 |
85+ |
All ages |
IN |
14 |
33 |
35 |
10 |
5 |
2 |
1 |
0 |
0 |
100 |
OUT |
14 |
23 |
30 |
15 |
8 |
5 |
3 |
1 |
1 |
100 |
1 National Health Service Central Register (NHSCR) patient movements mid-2007 to mid-2008.
2 Totals are based primarily on International Passenger Survey (IPS) data. However, the sample size in Scotland is too small to give an age breakdown so an age distribution is assumed using NHSCR data.
3 Note that the movements between Scotland and the rest of the UK and overseas will not sum to the total net migration as they exclude movements to and from the armed forces and rounding adjustments.
Migration and the distribution of people in Scotland
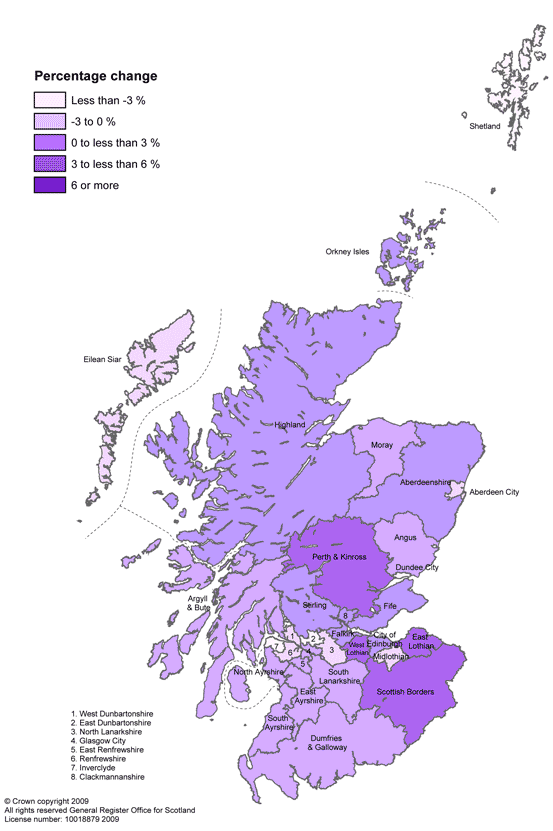
In many parts of Scotland, migration is the most important component of population change. Net migration rates (here, the amount of net migration between 1998 and 2008 as a proportion of the 1998 population) are a useful indicator when comparing migration between areas of different sizes. Information on net rates for Council areas is shown in Figure 4.6.
The patterns of migration over the period 1998 to 2008 indicate that the highest net out-migration rates were in Shetland Islands, East Dunbartonshire and Inverclyde. The highest net in-migration rates were in Perth & Kinross, East Lothian and Scottish Borders.
Figure 4.6 Net migration as percentage of population by local authority area, 1998 to 2008
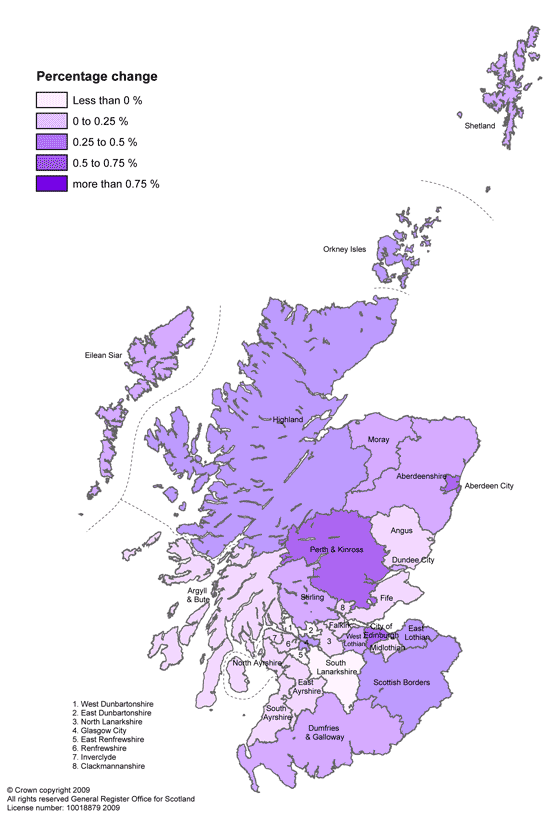
The role of outside Scotland migration shows a slightly different pattern. Migration between mid-2007 and mid-2008 to and from areas outside Scotland, as a proportion of the resident population, is shown in Figure 4.7. The highest net in-migration rates were in the city areas of Aberdeen, Edinburgh and Glasgow as well as Perth & Kinross and Highland. The highest net out-migration rates were in East Renfrewshire, South Lanarkshire, East Dunbartonshire and West Dunbartonshire.
Figure 4.7 Net migration with areas outside Scotland as percentage of population by local authority area, mid-2007 to mid-2008
Improvements in migration statistics
Since the early 2000s, and especially since Eastern European countries joined the EU in May 2004, migration has played a larger part in Scotland’s demographic change than in the previous decade. So it has become more important to have high quality statistics on migration and the population, for policy development and for planning and providing public services. GROS is part of an inter-departmental effort, led by the Office of National Statistics, to improve the estimates of migration and migrant populations in the United Kingdom, both nationally and at a local level. The Improvements to Migration and Population Statistics (IMPS) cross-government programme involves:
Within Scotland, we plan to use the improved statistical information thus available, to improve progressively the population estimates and projections which we prepare and publish. This includes: