Contents Next
1. What are the key trends?
1.1 What are the changes in household numbers?
- In 2013, there were 2.4 million households in Scotland, an increase of around
171,000 households (eight per cent) over the last 10 years.
- There were 2.5 million dwellings, including 72,000 vacant dwellings and 35,000
second homes. The number of dwellings is up by 171,000 (seven per cent) over
the last 10 years.
- The number of households in Scotland grows every year. However, the rate of
growth was increasing in the lead up to the economic downturn which began in
2007/8, but since then, the annual increase has fallen.
- Between 2002 and 2008, before the economic downturn began, there was an
average increase of 20,500 households per year. Between 2008 and 2013, the
average yearly increase has been lower, at 13,800.
- In 2013, for the first time since the downturn began, the annual increase in the
number of households grew, showing an increase of 14,600 (0.6 per cent,
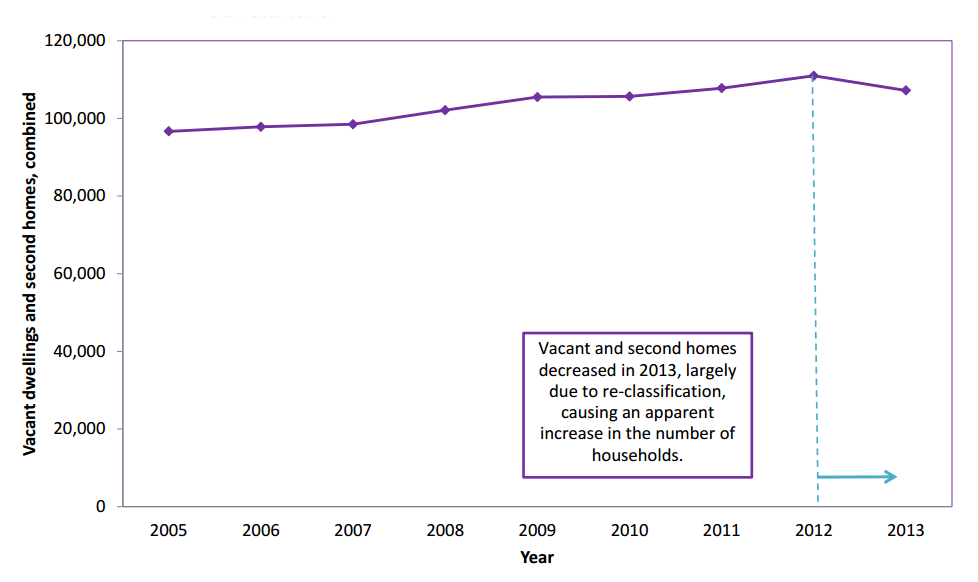
Figure 1). However, this is not due to growth in the number of dwellings.
Instead, it is due to an apparent drop in the number of second homes and empty
properties. This drop is mainly due to councils re-classifying which properties
were classed as being long-term empty or second homes, due to Council Tax
changes (Figure 2).
Figure 1: Annual increase in the number of households in Scotland between 2001 and 2013
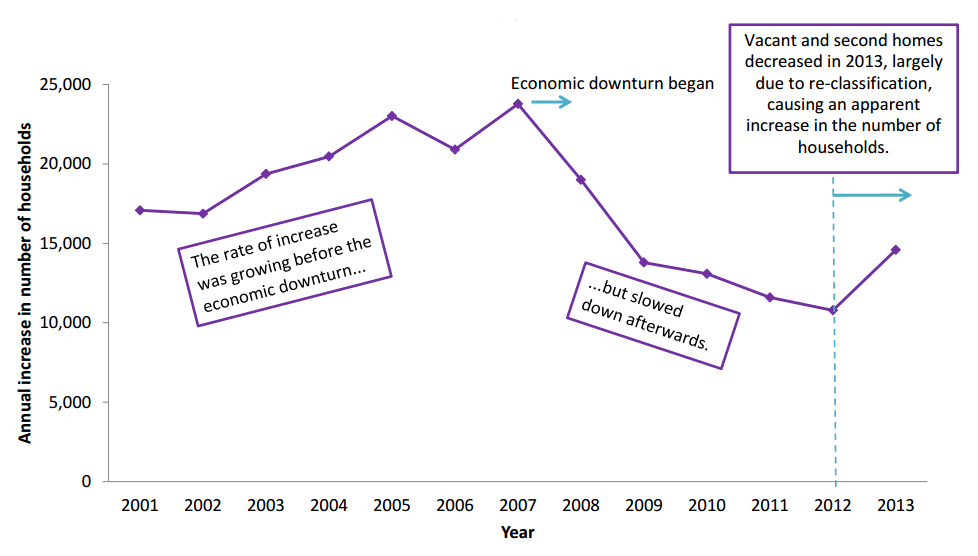
Figure 2: Vacant dwellings and second homes in Scotland, combined, 2005 to 2013
1.2 What are the changes in vacant dwellings and second homes?
- In an effort to encourage the availability of housing to meet the needs of a growing population1, councils across Scotland have been making efforts to bring vacant properties back into use.
- The Scottish Government has introduced new regulations2 which allow councils
to increase the Council Tax charges on certain long-term empty properties. As a
result of this, some councils have carried out reviews of which properties are
classified as being vacant or second homes, and this has led to changes in the
figures. The 2013 data shows the figure dropping as a result.
- Across Scotland, 2.8 per cent of dwellings are vacant and 1.4 per cent are
second homes. The number of vacant dwellings and second homes fell by 3,800
(3.4 per cent) over the last year. The Council areas with the biggest changes
had all carried out re-classification exercises, which affected their figures. This
makes it difficult to determine how much of the change was due to homes being
brought back into use.
- In the coming years, more councils are likely to follow suit and also carry out
their own re-classifications and review of the charges applied. Future household
estimates publications will continue to monitor any changes.
- Remote rural areas continue to have the highest percentage of dwellings that
are vacant and second homes (4.9 and 6.8 per cent respectively, compared to
2.6 and 0.9 per cent in large urban areas). The proportion of vacant dwellings is
generally higher in more deprived areas (4.1 per cent in the most deprived areas
compared to 1.6 per cent in the least deprived areas).
1.3 Other contributing factors to the changes in household numbers
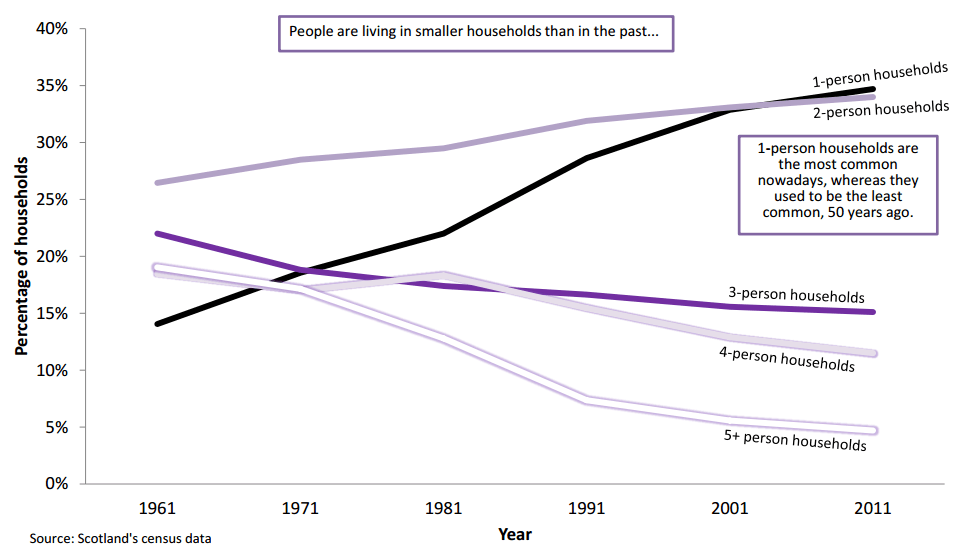
- People are living in smaller households than in the past. Over the last 50 years,
the number of one-person households has gone from being the least prevalent
household type, to the most prevalent type, and there are fewer large
households. This has led to an increase in the number of households and a fall
in average household size. However, over recent years, this trend has been
slowing down (Figure 3).
Figure 3: Change in household types in Scotland, 1961 to 2011
- The formation of new households is also affected by the availability of housing.
New housing contruction has fallen since the economic downturn which began
in 2007/8, which also constrained mortgage and labour markets3,4,5
.
- The population of Scotland increased by five per cent in the last decade6. The changes in household composition have led to a larger increase in the number
of households over the same period (by eight per cent).
1.4 What links are there with deprivation?
- More deprived areas tend to have a higher density of housing, more flats, and
more dwellings in the lower value Council Tax bands.
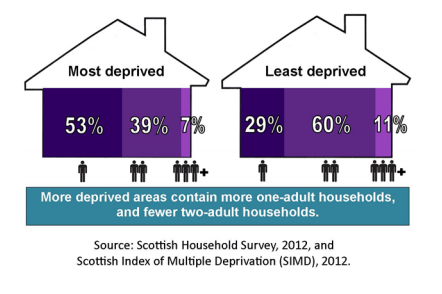
- More deprived areas generally contain more households with just one adult
(with or without children). This ranges from over half of all households being of
this type in the 10 per cent most deprived areas, to just over a quarter of
households in the least deprived areas. In contrast, there are more two-adult
households (where there is the potential for both adults to be earning), in the
less deprived areas (Figure 4).
Figure 4: Estimates of the percentage of households by household type by level of deprivation, Scotland, in 20127
Footnotes
Contents Next