The key points, relating to Scotland’s National Parks are:
Household Type
Age Group
The following table shows a summary of the percentage changes in population and the number of households, for National Parks and the whole of Scotland, over the projection period 2008-2033,
Table C: Percentage change in population and number of households, for National Parks and the whole of Scotland, 2008 to 2033
| CNP | LLTNP | Scotland | |
|---|---|---|---|
| Population | 20% | -10% | 7% |
| Children (0-15) | 0% | -25% | -2% |
| Working Age1 | 16% | -20% | 2% |
| Pensionable Age2 | 43% | 24% | 31% |
| Households | 31% | 2% | 21% |
| Headed by under 60 year old | 14% | -22% | 7% |
| Headed by over 60 year old | 56% | 35% | 47% |
| Household types | |||
| 1 adult | 61% | 30% | 49% |
| 1 adult, 1+ children | 72% | 34% | 46% |
| 2+ adults | 24% | 1% | 12% |
| 2+ adults, 1+ children | -24% | -47% | -27% |
| Average household size 2008 | 2.07 | 2.29 | 2.18 |
| Average household size 2033 | 1.88 | 2.00 | 1.93 |
1 Working age is 16-59 for women and 16-64 for men
until 2010. Between 2010 and 2020 working age becomes 16-64 for
women. Between 2024 and 2026, working age for both men and women
becomes 16-65 and changes again, in two further steps, to 16-67 by
2046.
2 Pensionable age is 65 for men and 60 for women
until 2010. Between 2010 and 2020, the pensionable age for women
increases to 65. Between 2024 and 2026, the pensionable age for
both men and women increases to 66 and changes again, in two
further steps, to 68 by 2046.
2.2.1 Overall number of households (Tables 1a and 1b)
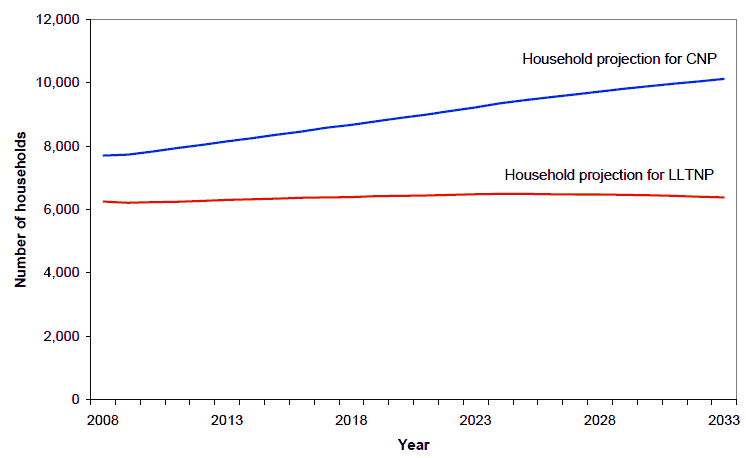
The number of households in Scotland is projected to increase from 2.3 million to 2.8 million between 2008 and 2033, an increase of 21 per cent. The number of households in CNP is projected to increase from 7,700 to 10,120, an increase of 31 per cent whereas in LLTNP the number of households is projected to increase from 6,250 to 6,380, an increase of only two per cent.Over the same period of time the population of CNP is projected to increase by around 20 per cent whereas the population of LLTNP is projected to decrease by 10 per cent. Figure 1 shows the household projections for both National Parks from 2008 to 2033.
The average household size is projected to decline in both National Parks; in CNP from 2.07 in 2008 to 1.88 in 2033 and for LLTNP from 2.29 to 2.00.
Figure 1: Projected number of households in National Parks, 2008-2033
2.2.2 Types of household (Tables 1a and 1b)
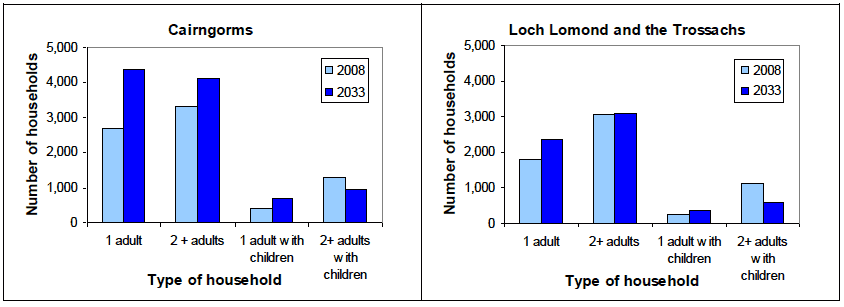
Figure 2 shows the projected number of households by household type, in 2008 and 2033 for each National Park.
There are projected increases in the number of single adult households in both National Parks. In CNP the number of adults living alone is projected to increase from 2,700 (35 per cent of all households) in 2008 to 4,360 (43 per cent) by 2033. In LLTNP the projected increase is from 1,800 (29 per cent) to 2,340 (37 per cent).
Households containing two or more adults without children are also projected to increase in both National Parks. In CNP the increase is from 3,320 to 4,110 households and in LLTNP the increase is smaller, from 3,060 to 3,090 households.
The number of one adult with children households is projected to rise in both National Parks. In CNP the increase is from 400 to 690 and in LLTNP the increase is from 260 to 350.
In contrast, the number of larger households is projected to fall, with households containing two or more adults with children decreasing in both National Parks. In CNP the decrease is from 1,280 to 970, and in LLTNP the decrease is from 1,120 to 590.
Figure 2: Projected number of households in National Parks by household type, 2008 and 2033
2.2.3 Age group of head of household (Tables 2a and 2b)
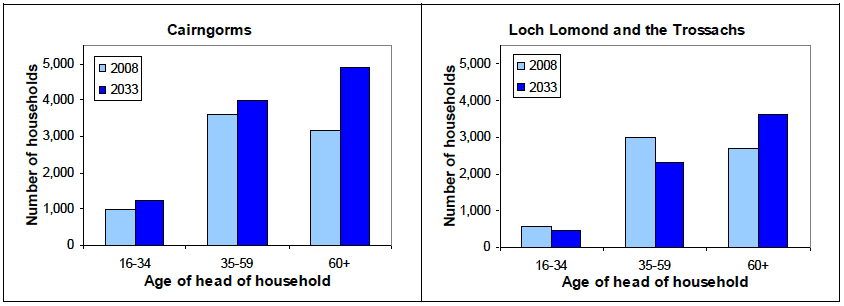
Figure 3 shows the projected number of households in 2008 and 2033, by the age group of the head of household (the ‘head’ of household is normally the first person entered on the Census form).
The population projections show that the National Park population is ageing with projected increases in the number of people in the older age groups. This trend is reflected in the household projections, with the largest increases shown in households headed by people aged 60 and over. In CNP there is a projected increase of 56 per cent from 3,150 to 4,910 households and in LLTNP there is a projected 35 per cent increase from 2,690 to 3,610 households.
Households headed by people aged 60 and under are projected to increase by over 14 per cent in CNP from 4,550 to 5,210. However, for LLTNP there is a projected 22 per cent decrease in younger households, from 3,560 to 2,760.
Figure 3: Projected number of households in National Parks by age group of head of household, 2008 and 2033
2.2.4 Household type by age group of head of household (Tables 3a, 3b, 4a and 4b)
One adult households
In 2008, 20 per cent of the population in CNP aged 16 or over lived alone, and this is projected to increase to 26 per cent by 2033. In LLTNP the corresponding projected increase is from 15 per cent to 20 per cent. Tables 4a and 4b show that people are more likely to live alone over the age of 60. In both National Parks, men are more likely to live alone until the age of 60. However from the age of 60 onwards, women are more likely to live alone. This is influenced by women’s greater life expectancy and the tendency of women to marry men who are older than them.
Households containing one adult with children
In 2008 in CNP, five per cent of all households consisted of one adult living with one or more children. This percentage is projected to increase to seven per cent in 2033. In LLTNP the corresponding percentage for 2008 was four per cent, which is projected to increase to six per cent in 2033.
Households containing two or more adults without children
For both National Parks, in the older age groups, there are large projected increases in the number of households containing two or more adults without children. For CNP for this type of household, headed by someone aged 60 or over, there is a projected increase of 45 per cent from 1,660 to 2,410 households. Corresponding figures for LLTNP project a 26 per cent increase from 1,590 to 2,010 households. In contrast, there is a small projected decrease of two per cent, in this type of household for the 35-59 age group for CNP. In LLTNP there are projected decreases for both younger age groups. The projected decrease for age group 16-34 is nine per cent and for age group 35-59 is 29 per cent.
Households containing two or more adults with children
In both National Parks, there is a projected decrease in the number of households with two or more adults with children. In 2008, 17 per cent of households contained two or more adults with children in CNP, and this figure is projected to fall to 10 per cent by 2033. Similarly in LLTNP in 2008, 18 per cent of households contained two or more adults with children, and this figure is projected to fall to nine per cent in 2033.