The number of deaths registered in Scotland in 2001 represents the lowest total since civil registration began in 1855. 57,382 deaths were recorded – a fall of 6 per cent from ten years ago and nearly 13 per cent below the level in 1951.
As would be expected, the majority of deaths occur at older ages – about 57 per cent of deaths were to people aged 75 and over, and a further 27 per cent between the ages of 60 and 75.
As mortality rates have fallen over time while the elderly population has grown, the net effect has been to maintain a relatively stable number of deaths at 60–65,000 a year. Although the number of deaths has fallen well below 60,000 in 2000 and 2001 the number of deaths will almost certainly increase over the next 40 years, even if mortality rates continue to improve slowly, as the large number of people born in the baby boom after the Second World War and the 1960s grow older. While improvements in mortality rates are likely to continue, it is unlikely that they will improve at such a rate as to offset the projected increase in deaths resulting from a sharp growth in the number of the elderly.
Improvements in mortality rates in Scotland have generally been slower than in the rest of the UK and elsewhere in Europe. But the improvements are still considerable and the impact is demonstrated in the steadily rising expectation of life for males and females over the last 50 years. The impact of mortality on the age structure of the population is given in more detail in Chapter 2.
Deaths in 2001 and past trends
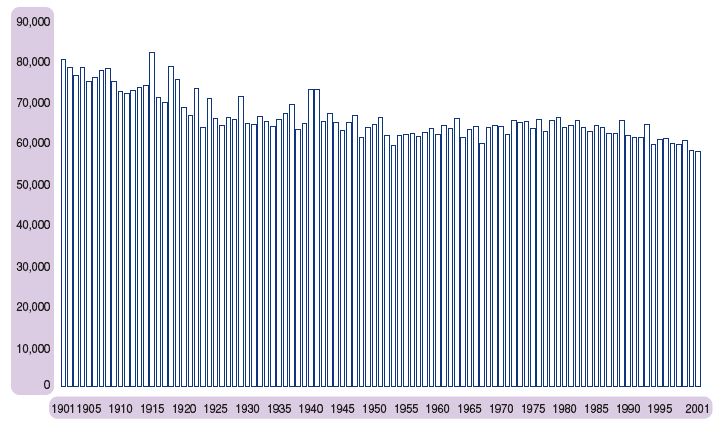
The number of deaths in the last 100 years is presented in Figure 4.1. It shows that since the early 1920s, the number of deaths has remained relatively stable at about 60-65,000 a year. Deaths first fell below 60,000 in 1953, then again in 1967, but not again until 1994. They have remained either below or just over the 60,000 mark since. While there has been a high degree of stability in the number of deaths over the last century, outbreaks of ’flu have caused periodic peaks in deaths such as in 1922 and 1989.
Figure 4.1 Deaths, Scotland, 1901–2001
Stillbirths and infant deaths
The biggest improvements in mortality have been seen in stillbirth, perinatal and infant death rates. Figure 4.2 shows rates of stillbirths, perinatal deaths and infant deaths over the last 50 years. The stillbirth rate has improved by 79 per cent from 26.6 per 1,000 total births in 1951 to 5.7 in 2001, despite a change in the definition of stillbirths in 1992 which reduced the minimum period of gestation from 28 weeks to 24 weeks thus increasing the numbers classified as stillbirths. The rate of perinatal deaths (deaths and stillbirths in the first week of life) fell from 44.2 per 1,000 total births in 1951 to 8.5 in 2001, an improvement of 80.8 per cent. Finally, the infant death rate (deaths of children under 1) has improved by 85 per cent from 37.4 per 1,000 live births in 1951 to 5.5 in 2001.
Figure 4.2 Stillbirth, perinatal and infant death rates, Scotland 1951–2001
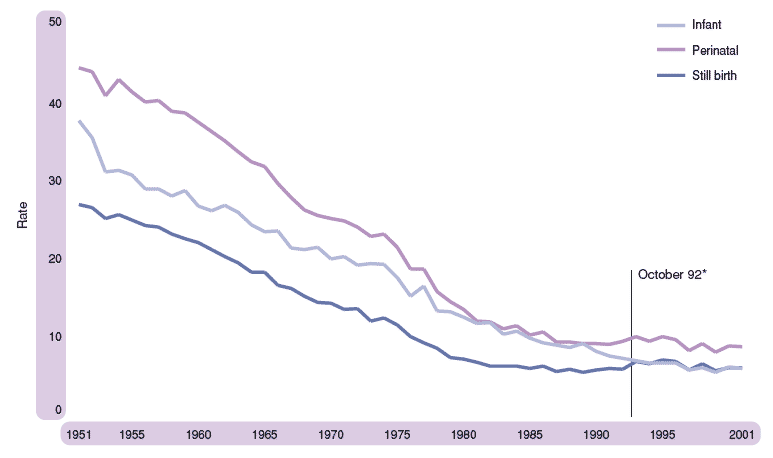
* Change in definition of stillbirths from 28 to 24 weeks
These dramatic improvements have also occurred in other western countries and are the result of a number of factors. In the main these are due to improvements in the environment and living conditions into which babies are born, and in the care and treatment of babies, including better medical care and a wider use of midwives. The infant death rate of 5.5 per 1,000 births in Scotland is the same as the UK rate but is still above the EU rate of 4.9.
Life expectancy
Life expectancy is a commonly used measure to show the effects of current levels of mortality on the length of time people at various ages can expect to live. It is very useful in comparing the ‘health’ of a nation through time and with other nations.
During the last 50 years, there have been considerable improvements in life expectancy at birth as shown in Figure 4.3. Males born in 1951 could, at that time, expect to live to 64.4 years, compared with 73.4 years for those born in 2001. Similarly, females have experienced an improvement of ten years from 68.7 years in 1951 to 78.8 in 2001.
Males aged 65 in 2001 could expect to live a further 15.0 years compared with 11.4 years in 1951, while women aged 65 in 2001 could expect to live another 18.1 years compared to 13.2 years in 1951.
While mortality has fallen for both men and women, male life expectancy has remained 5.5 years lower than female life expectancy over the last 50 years. Figure 4.3 also illustrates that improvements in life expectancy at birth are projected to continue, rising to 77.3 for males and 82.2 for females by 2040.
Figure 4.3 Expectation of life at birth, Scotland, 1952–2040
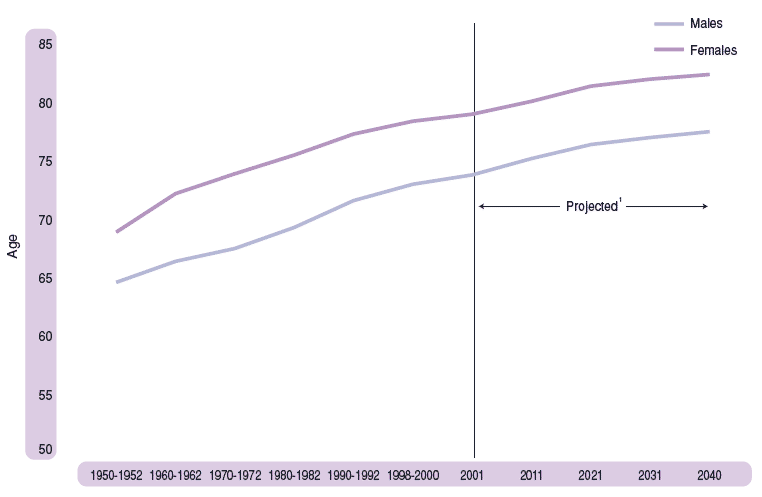
1 2000-based projections
Mortality by age
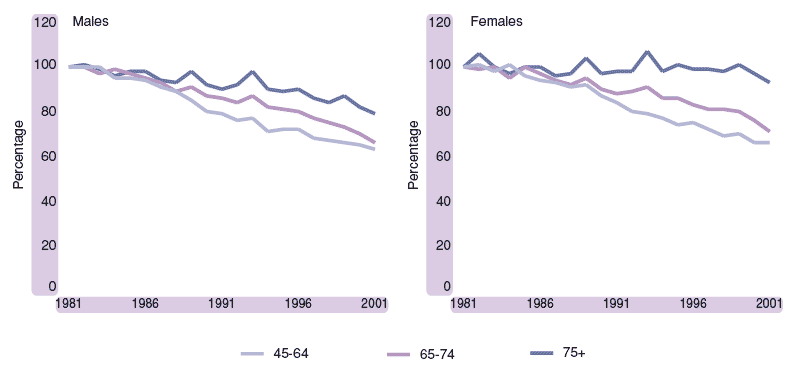
The relative stability in the number of deaths over the last 50 years masks large improvements in age-specific mortality. Figure 4.4 shows the age specific mortality rates over the last twenty years relative to the 1981 rate for both men and women in the age groups 45-64, 65-74 and 75+ (which between them accounted for about 95 per cent of all deaths in 2001).
There have been greater improvements in male mortality for these ages than females. For the 45-64 and 65-74 age groups, both males and females experienced large and similar improvements of about 35 per cent for 45-64 year olds and about 30 per cent for 65-74 year olds. However, the striking difference is in the improvements in male mortality rates for the 75 plus age group of nearly 20 per cent, compared with only small improvements for females.
Figure 4.4 Age specific mortality rates as a proportion of 1981 rate, 1981–2001
There were 246 deaths of centenarians registered in 2001. This was 106 more than in 1991, and reflects improving mortality at the very elderly ages as well as an ageing population.
Regional variations within Scotland
Standardised mortality ratios (SMRs), which compare local death rates with death rates in Scotland as a whole, taking account of the different population structure of each area, are presented in Figure 4.5. In all, 11 out of 32 Council areas have a higher standard mortality ratio than the Scottish average of 100, and 8 of these are in west central Scotland. The worst, Glasgow City, is 22 per cent higher than the Scottish average which itself is about 15 per cent higher than the UK average.
Figure 4.5 Standardised mortality ratios, by Council area, 2001
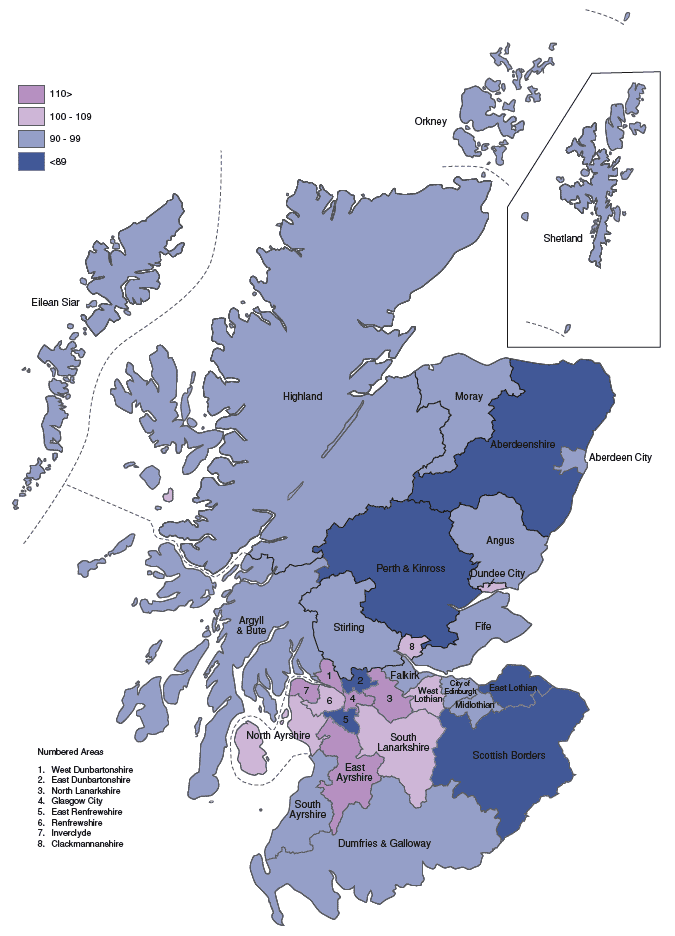
At the other end of the scale, mortality rates in East Dunbartonshire and East Renfrewshire were 19 per cent below, or better than, the Scottish average. Aberdeenshire and Perth & Kinross were both 15 per cent below the Scottish average.
The number of deaths in each area reflects deaths in Scotland of residents of the area plus deaths in the area to non-Scottish residents as recorded by the civil registration system. In some areas, deaths of non-Scottish residents will have a noticeable impact on the death rate and this is particularly true of some rural areas, perhaps reflecting higher levels of tourism or a specific tourist activity. For instance, in Highland, 2.8 per cent of all deaths were to non-Scottish residents.
Mortality within the UK and the EU
Although mortality rates have been improving in Scotland, the rate of improvement is slower than elsewhere in the rest of the UK. Over the last 25 years the mortality rates have improved by 40 per cent in Northern Ireland and 35 per cent in both England and Wales compared with 30 per cent in Scotland.
A comparison of the crude death rates (deaths per 1,000 population) for Scotland and selected other countries is presented in Figure 4.6. It shows that Scotland has a death rate (11 per 1,000 population) considerably higher than the EU average (10 per 1,000 population) and higher than any other country shown apart from Wales. However, when considering the SMR, which takes account of the population’s age structure, the UK comparison is very different. The SMR in Scotland is about 15 per cent higher than the UK rate, while Wales is only 4 per cent higher.
Figure 4.6 Deaths per 1,000 population, selected countries, 20001
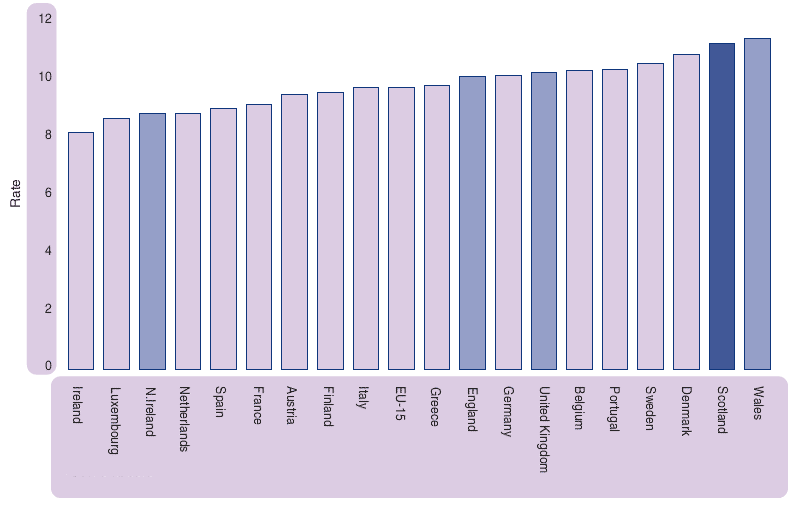
1 Scotland data are for 2001. All 2000 date are provisional
Source: ONS, Eurostat
A better indicator for comparing the "health" of Scotland with other countries is expectation of life, since this takes account of the age structure of the population which can differ significantly and affect the overall crude rate. This is particularly true where countries have a higher proportion of young or elderly within their populations.
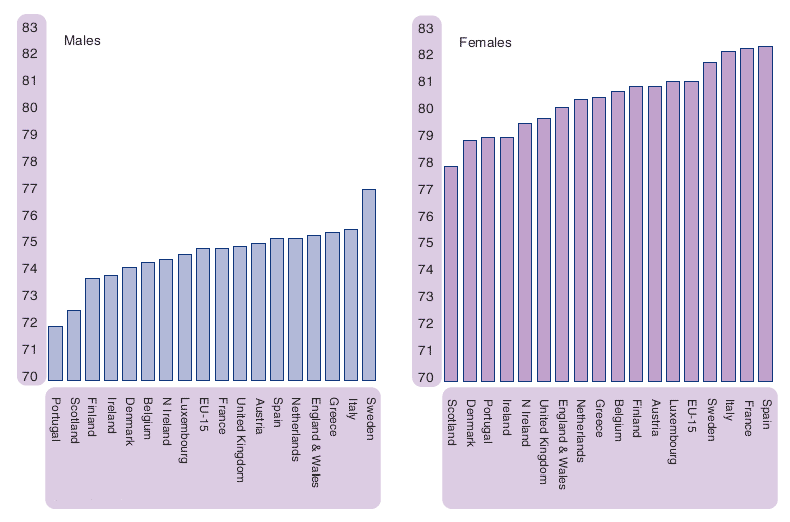
Figure 4.7 gives expectation of life at birth for selected countries in 1999. It shows that, despite the improvements in mortality, Scottish females have the lowest expectation of live at birth in the EU and males the second lowest after Portugal. For both sexes, the expectation of life is more than four years lower than the countries with the highest expectation of life and over 2 years below the EU average.
Figure 4.7 Expectation of life at birth, by sex, selected countries, 1999
Source: ONS, Eurostat
Cause of death
The two most common causes of death in Scotland in 2001 were cancer (26 per cent) and ischaemic heart disease (21 per cent). However, since 1981 the proportion of deaths caused by ischaemic heart disease has fallen from 29 to 21 per cent, whereas the proportion caused by cancer has risen from 22 to 26 per cent. Since 1995, there have been more deaths from cancer than ischaemic heart disease. Of the 15,196 deaths from cancers in 2001, trachea, bronchus and lung was the most common site, accounting for over a quarter (26 per cent) of all cancer deaths.
Death rates, by sex, for the most common causes of death are shown in Table 4.1. Over the last 20 years or so, death rates for men from lung cancer have fallen by 20 per cent (119 per 100,000 population in 1980-82 to 94 in 2001). In contrast, rates for women have increased by over 50 per cent (41 per 100,000 females in 1980-82 to 62 in 2001), but are still considerably lower than the level experienced by men.
Table 4.1 Death rates from selected causes, by sex, Scotland, 1950–2001
Males – rates per 100,000 population
Year |
Cancer |
Ischaemic heart |
Cerebrovascular |
||
|---|---|---|---|---|---|
All sites |
Trachea, bronchus |
Prostate |
|||
1950–52 |
206 |
48 |
13 |
276 |
155 |
1960–62 |
241 |
86 |
16 |
360 |
166 |
1970–72 |
272 |
112 |
14 |
407 |
158 |
1980–82 |
291 |
119 |
19 |
408 |
139 |
1990–92 |
310 |
110 |
27 |
363 |
118 |
2001 |
319 |
94 |
32 |
257 |
100 |
Females – rates per 100,000 population
Year |
Cancer |
Ischaemic heart |
Cerebrovascular |
||
|---|---|---|---|---|---|
All sites |
Trachea, bronchus |
Breast |
|||
1950–52 |
185 |
10 |
31 |
203 |
213 |
1960–62 |
195 |
13 |
35 |
262 |
230 |
1970–72 |
218 |
24 |
40 |
289 |
226 |
1980–82 |
247 |
41 |
45 |
304 |
210 |
1990–92 |
278 |
57 |
48 |
297 |
191 |
2001 |
282 |
62 |
43 |
215 |
159 |
The next most frequent site for cancer deaths was prostate for men (777 deaths of which 65 per cent occurred in men aged 75 and over) and breast for women (1,143 deaths). Death rates for the former continue to increase whereas those for the latter have shown a slight fall in recent years.
In contrast to the rise in death rates resulting from cancer, death rates for ischaemic heart disease and cerebrovascular disease (stroke) have shown significant declines. Over the last twenty years, males have experienced the larger improvements, 37 per cent for ischaemic heart disease and 28 per cent for stroke, compared with improvements of 29 and 24 per cent, respectively, for females.
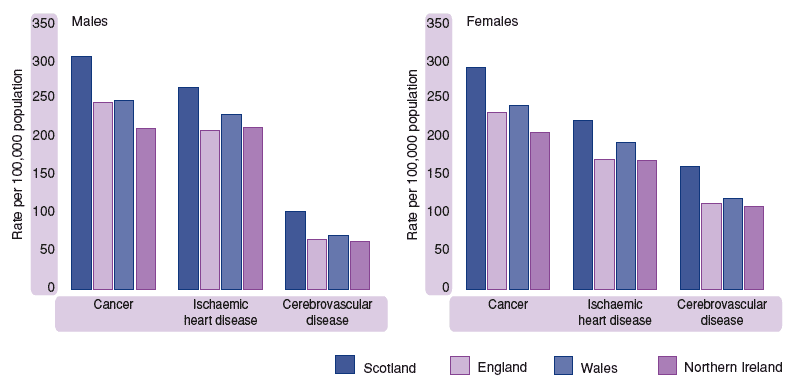
Using the latest comparable data available, Figure 4.8 compares the death rates for the constituent countries of the UK for selected causes after adjusting for differences in age structure. The Scottish rates for cancer and ischaemic heart disease remain well above the rates for the other countries of the United Kingdom for both men and women.
Figure 4.8 Age adjusted mortality rates, by selected cause and sex, 2000
Source: ONS, NISRA
There were 1,061 deaths from chronic liver disease in 2001 (more than double the number in 1991), of which over 80 per cent were known to be alcohol related.
In 2001, deaths from intentional self-harm (suicide) numbered 609 (441 males and 168 females), 39 fewer than in 2000. To allow for the under-recording of suicides, a more robust measure is to combine deaths classified as events of undetermined intent with those for intentional self-harm, as is done in international comparisons. The total number of deaths classified to these two groups was 887 in 2001, compared with 878 in 2000 and 728 in 1981. For men the most frequent cause of these deaths was hanging, strangulation and suffocation, whereas for women it was poisoning.
There were 332 drug-related deaths in 2001, 40 (14 %) more than in 2000 and 88 per cent more than in 1996. Heroin/morphine was involved in 216 (65%) of the deaths; diazepam was involved in 156 (47%) and methadone was involved in 69 (21%). A wide range of drug combinations was recorded. Of particular note was the fact that diazepam was also mentioned in over half (110) of the 216 deaths involving heroin/morphine. The presence of alcohol was mentioned for 140 of the 332 drug-related deaths in 2001. More detailed information on Drug Related Deaths can be found in the GROS Occasional Paper Drug Related Deaths in Scotland in 2001 available on the GROS website at www.nrscotland.gov.uk.
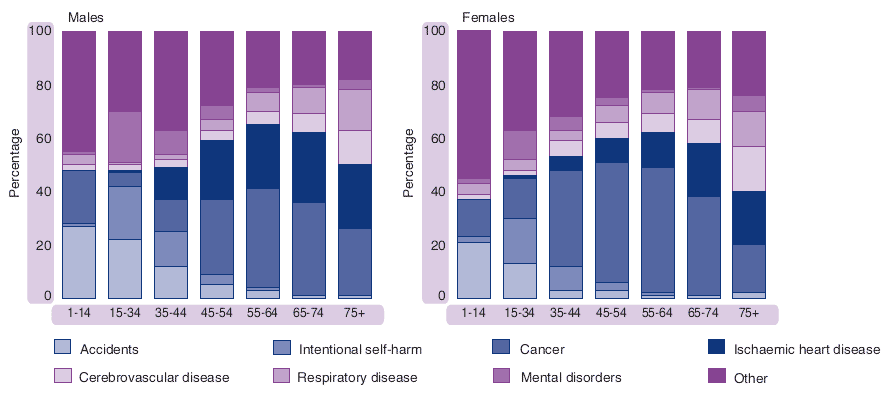
Summary of main causes of death by age and sex
The main causes of death vary in importance by age and sex (Figure 4.9). Accidents were the most important category of death in the very young (aged 1-14), accounting for 27 per cent of deaths in boys and 21 per cent of deaths in girls in 2001. Cancer, at 20 per cent for boys and 14 per cent for girls, was the next largest cause.
For males aged 15-34, the main category was accidents followed by intentional self-harm (suicide) and mental disorders (entirely due to drug and alcohol abuse). For females in this age group suicide was the largest category followed by cancer.
For almost all age/sex groups above age 35, the main cause was cancer. For women, cancer was responsible for a higher proportion of deaths in almost every age group than for men. Conversely, ischaemic heart disease accounted for a higher proportion of deaths in all age groups for men than for women.
Figure 4.9 Deaths, by cause and age group, Scotland, 2001