Appendix 2: NRS Statistics Flowchart
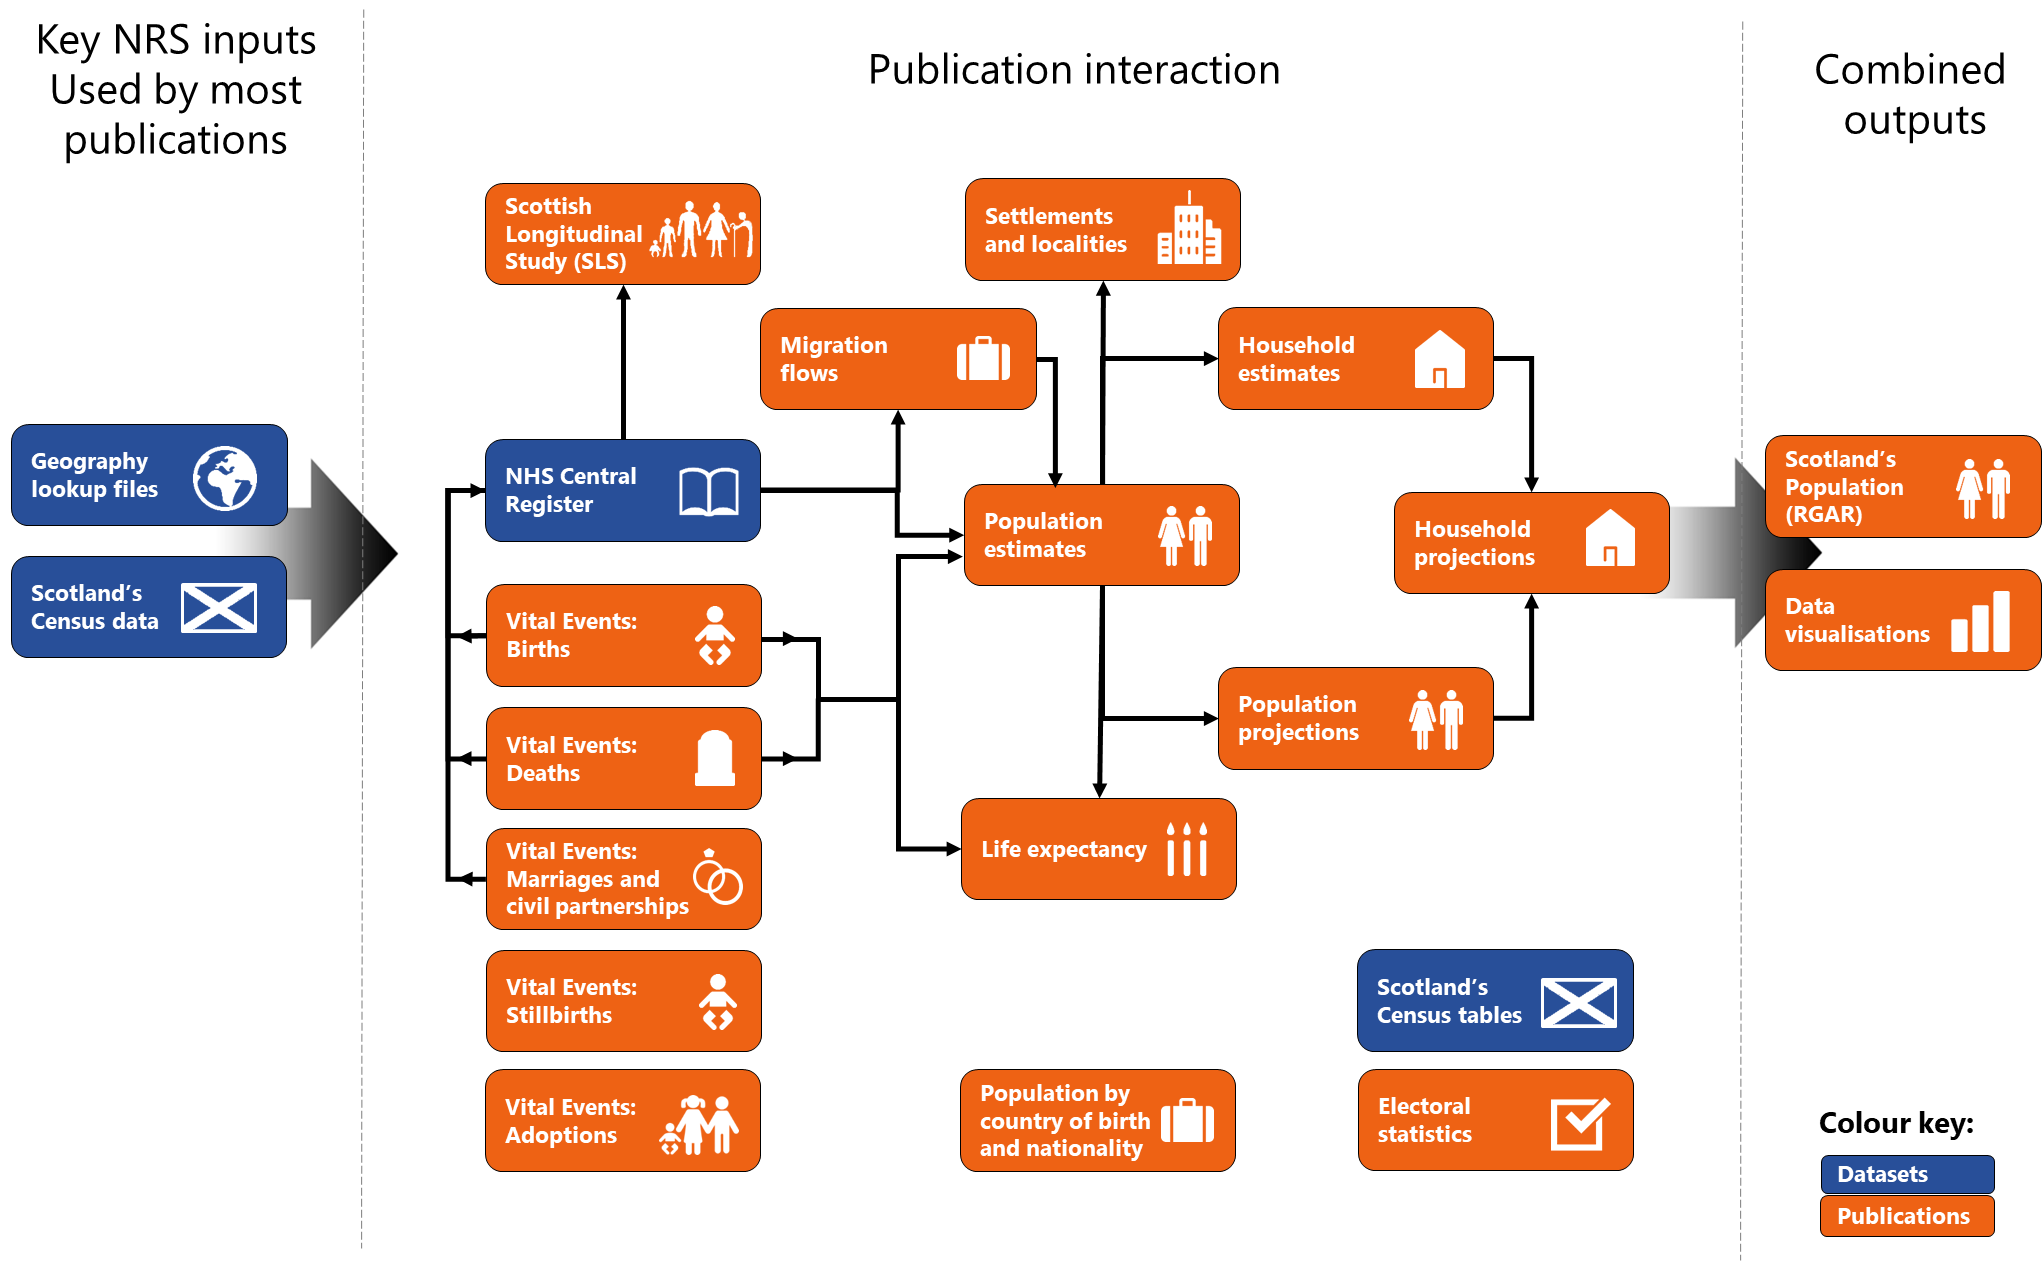
This year, we have developed a flowchart that maps out all the demographic statistics produced by NRS and shows how information is passed between our key publications.
Each box represents a publication topic (orange) or dataset (blue). The arrows represent the flow of data between publications and datasets.
The chart only shows how information is used within NRS; each publication also depends on data sharing with many vital external organisations