Chapter 4: Deaths
"Scotland has the highest age-standardised mortality rate of all the UK countries with 1,108 deaths per 100,000 population."
Deaths involving COVID-19
Chapter 1 provides an overview of deaths involving COVID-19. This chapter covers figures up to 2019, so it doesn’t include any deaths involving COVID-19. Instead, it gives an overview of overall death rates in Scotland in the years before the pandemic.
Deaths in Scotland, pre-pandemic
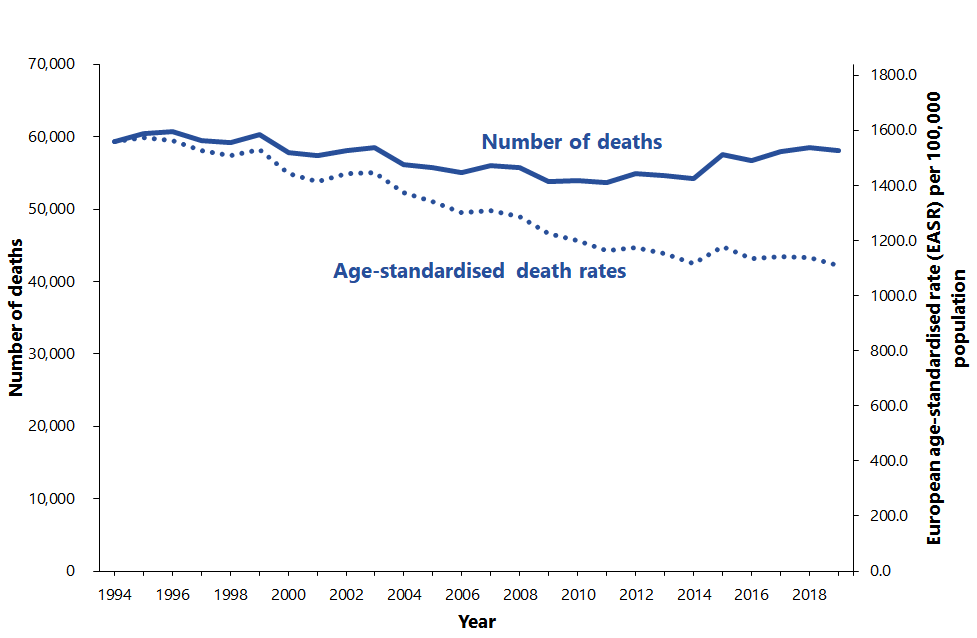
The number of deaths registered in 2019 was 58,108, a decrease of 0.7% on the number in 2018. This represented the second highest annual total since 1999, which might be expected, given our ageing population. The age-standardised death rate (which accounts for this) decreased consistently between 1999 and 2014, but has not changed much since. This suggests mortality rates have stopped improving.
After decreasing steadily over recent decades, there has been little change in the age-standardised death rate since around 2014 – in other words, it has stopped improving.
Figure 4.1: Deaths in Scotland, 1994-2019, numbers and age-standardised death rates
Why are age-standardised rates better than numbers for measuring mortality trends?
The population has been growing and ageing in recent years, and this will have an effect on the number of deaths. A larger population with a greater proportion of older people is likely to lead to more deaths each year. To account for this, we calculate age-standardised death rates which adjust for changes in the age structure of the population and show what the trend would be if the population had remained stable. We use the 2013 European Standard Population to calculate our rates. More information on how this is done is available in our web section on age-standardised mortality rates.
When did the mortality trend change?
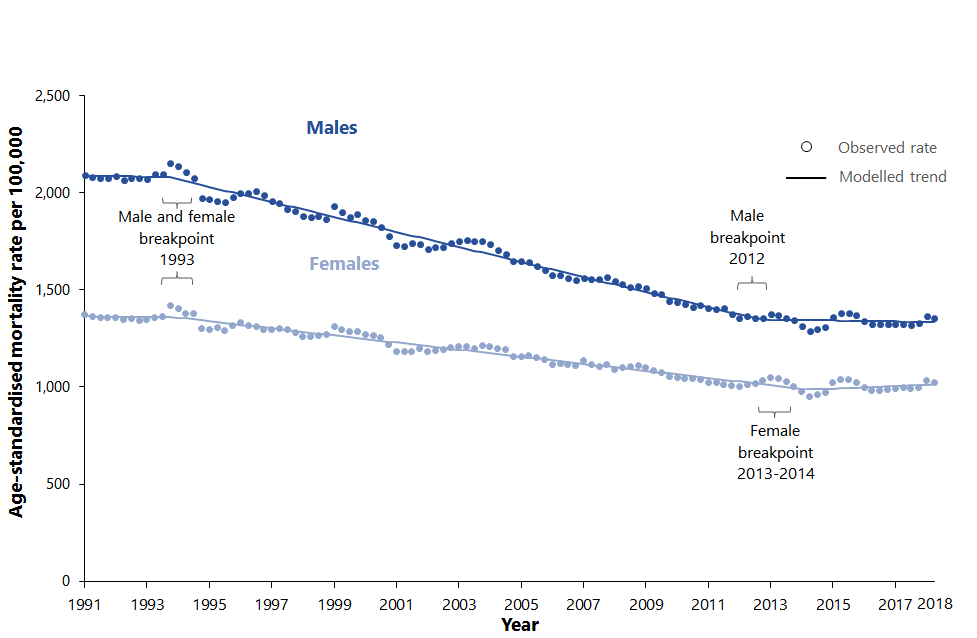
NRS worked with colleagues in the NHS to identify whether the mortality trend has changed. Segmented regression models were applied to the age-standardised mortality rates to identify turning points in the trend between 1990 and 2018. The results showed a statistically significant break in the mortality trend during the period 2012-2014. More detail is available in the article “Recent adverse mortality trends in Scotland: comparison with other high income countries”.
Figure 4.2: Breakpoints in age-standardised mortality trend, 1991 to 2018
Mortality by age
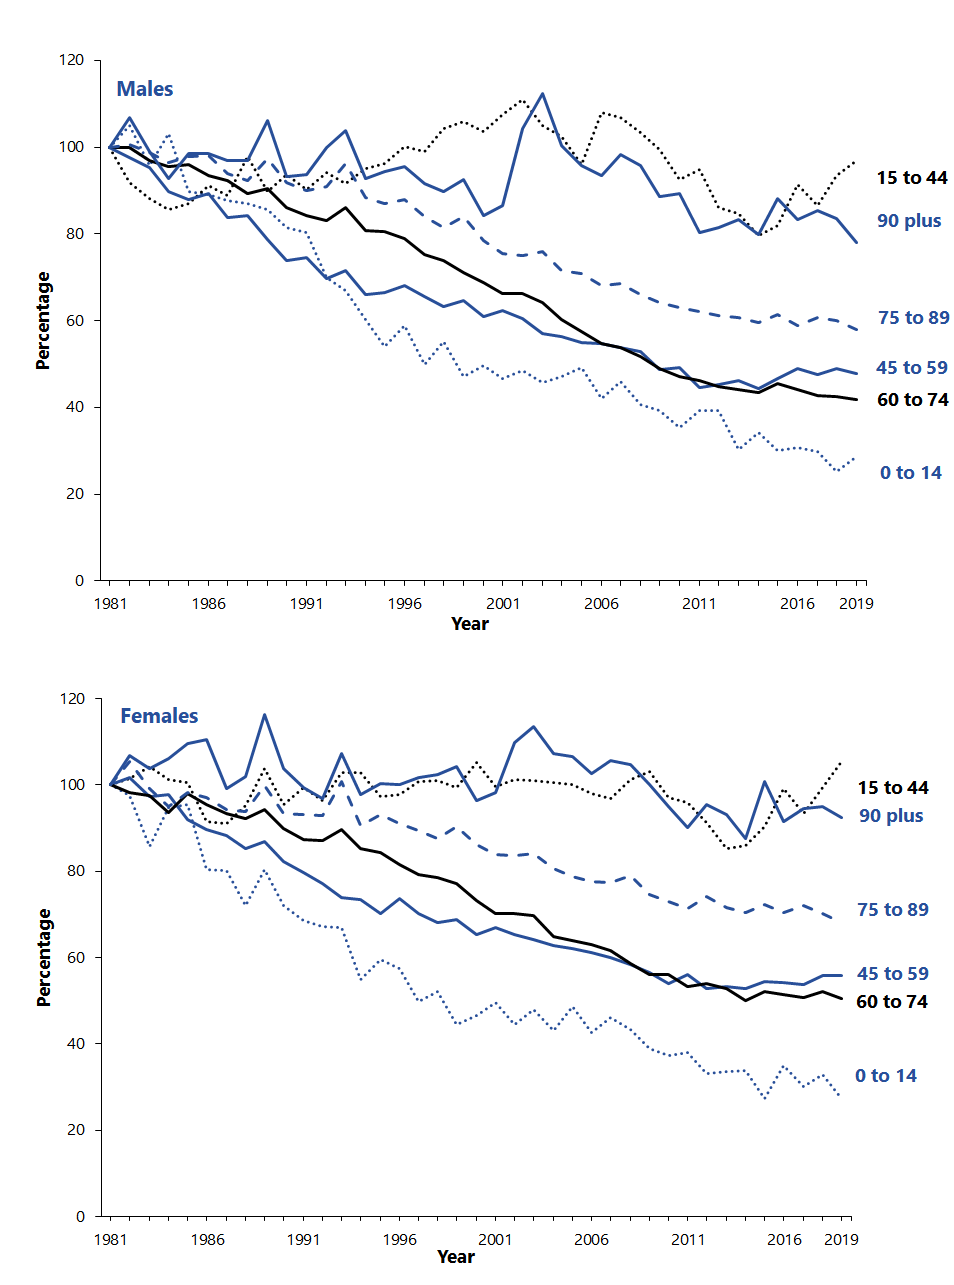
Figure 4.3 shows selected age-specific mortality rates over the last 38 years relative to the 1981 rates, for males (4.3a) and females (4.3b).
The greatest percentage decreases have occurred in the 0 to 14 age group with a decrease of 71% for males and 73% for females since 1981. Proportionately, however, the number of deaths in this age group is very small.
Excluding the youngest age group, the greatest decreases over the last 38 years have been in the 60 to 74 and 45 to 59 age groups. However, since 2011, mortality among 45 to 59 year old males has increased and there has been very little change for females. Mortality among 60 to 74 year old males has continued to decrease since 2011 but there has been a smaller decrease for females.
Mortality rates among 15 to 44 year olds have fluctuated over time due to the relatively low numbers of deaths in this age group compared to older groups. There are signs of increases in recent years (since 2014 for males and 2013 for females) but these should be interpreted with caution due to the small numbers.
Death rates in the 90 plus age group have decreased at a greater rate for males (by 22%) than for females (8%).
Figures 4.3a and 4.3b: Age specific mortality rates as a proportion of 1981 rate, 1981-2019
Deaths of People Experiencing Homelessness
In February 2020, we published statistics on homeless deaths in Scotland for the first time. The report provided experimental statistics on deaths of people experiencing homelessness, with breakdowns by sex and age-group, local authority and cause of death. Please refer to the report for an explanation of the methodology used.
There were an estimated 195 deaths of people experiencing homelessness in Scotland in 2018. This was an increase of 19% on the estimate of 164 in 2017. Around three quarters of homeless deaths were males (74% of the total in 2017 and 79% in 2018).
In 2018, Glasgow City (100.5) and Aberdeen City (67.8) had the highest homeless death rates per million population. More than half of homeless deaths in 2018 were drug-related (53%, 104).
The mean age at death was 43 for females and 44 for males.
Cause of Death
Due to delays in publishing cause of death statistics for 2019, there are no cause of death breakdowns included in this chapter. NRS has not received some of the information that it relies on to categorise many deaths. More detail on the reasons for the delay in publication of these statistics is available on our website. We hope to be able to publish the 2019 cause of death statistics in November and December 2020. The latest figures on cause of death are available from the ‘Deaths’ sections of our website.
Geographical variations in mortality
Figure 4.4: Age-standardised mortality rates for UK nations, 1994 – 2019
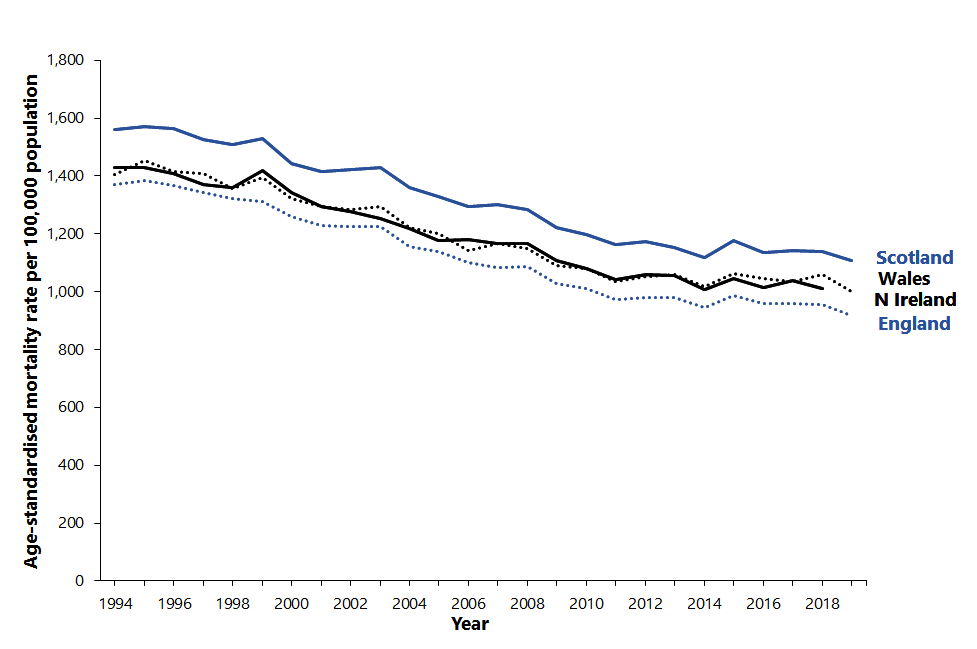
Scotland has consistently had the highest rate of age-standardised mortality of all UK countries. The current rate of 1,108 per 100,000 population is the lowest ever, but improvements have stalled in recent years. England had the lowest age-standardised mortality with 918 per 100,000 population.
How does Scotland compare to other European countries?
Appendix 1 – Table 3 shows the death rate for each of the EU member states, and for some other countries in Europe. These are crude death rates. They are calculated by expressing the number of deaths per 1,000 population. They do not take account of differences in the age structures of the countries’ populations. All else being equal, a country with an unusually high proportion of its population in the younger age groups could have unusually low crude death rates. So, although the figure for Scotland is higher than those for most of the countries that are shown, this could be partly explained by the structure of the Scottish population. A better way to compare Scotland’s mortality with other countries’ is to use the estimates of life expectancy for each country (please refer to Chapter 5 – Life Expectancy) or to consider age-standardised death rates.
Stillbirths, perinatal deaths and infant deaths
There were 174 stillbirths registered in Scotland in 2019. Stillbirths (where a child born after the 24th week of pregnancy does not breathe or show any other sign of life) are registered separately from live births and from deaths, and so are not included in either of those figures.
Perinatal deaths include stillbirths plus deaths in the first week of life (the latter are registered as live births and deaths). There were 84 deaths of children who were aged under one week old, so there was a total of 258 perinatal deaths.
Infant deaths are deaths in the first year of life, all of which are registered as live births and as deaths. In total, 165 infant deaths were registered in 2019 (including those who died in the first week of life).
Appendix 1 – Table 1 shows that in 2019 the stillbirth rate (3.5 per 1,000 live and still births) was the lowest rate ever recorded. The infant death rate (3.3 per 1,000 live births) was slightly higher than the previous year but very low in historic terms. Both rates have fallen greatly since the Second World War. The stillbirth rate has fallen slowly in the past 30 years but the infant death rate has continued a steeper decline over the same period.
Appendix 1 – Table 3 shows that the stillbirth rate for Scotland in 2019 (3.5 per 1,000 live and still births) was lower than that for the UK as a whole (4.0) but higher than those of 15 of the 27 EU countries. The infant death rate for Scotland in 2019 (3.3) was below the UK rate (3.9) but higher than those of 12 of the 27 EU countries.
All data on deaths, including previous year’s statistics on cause of death are available on the NRS website.