Chapter 5: Life Expectancy
"Life expectancy in Scotland is lower than anywhere else in western Europe. It has increased over the last few decades, but improvements have stalled in recent years"
COVID-19 and life expectancy in Scotland
The life expectancy statistics in this section are available up to the three year period 2017-2019, and do not include any data on deaths during the COVID-19 pandemic. COVID-19 was first mentioned on a Scottish death certificate in March 2020. In future years, these statistics will be able to show some of the effects of the pandemic on life expectancy in Scotland.
Life expectancy at birth in Scotland
Why do we report life expectancy for three year periods?
Official life expectancy statistics for Scotland are calculated by aggregating the latest three years of deaths and population estimates. This increases the sample size and improves the reliability of the results. It also reduces the effect that years with more ‘extreme’ values have on the data.
The most recent statistics show that life expectancy at birth in Scotland in 2017-2019 was 81.1 years for females and 77.1 years for males. This means that a baby girl born between 2017 and 2019 could expect to live for an average of 81.1 years, while a baby boy born at the same time could expect to live for 77.1 years.
Figure 5.1 shows that life expectancy has increased in Scotland from 75.3 years for females and 69.1 years for males born between 1980 and 1982. After 2017-2019, NRS use population projections to estimate how life expectancy will change in the future.
The latest projections are based on the year 2018 and show that by 2043, life expectancy in Scotland is expected to reach 83.8 years for females and 80.6 years for males. Although female life expectancy has always been greater than male life expectancy in Scotland (and globally), the gap between sexes has become smaller as life expectancy has increased. For babies born in 1981-1983, there was a gap of 6.2 years between males and females. In 2017-2019, this gap has narrowed to 4.0 years and the projections show that is expected to decrease further to 3.2 years by 2043.
Figure 5.1: Life expectancy at birth, Scotland, 1981-1983 to 2043
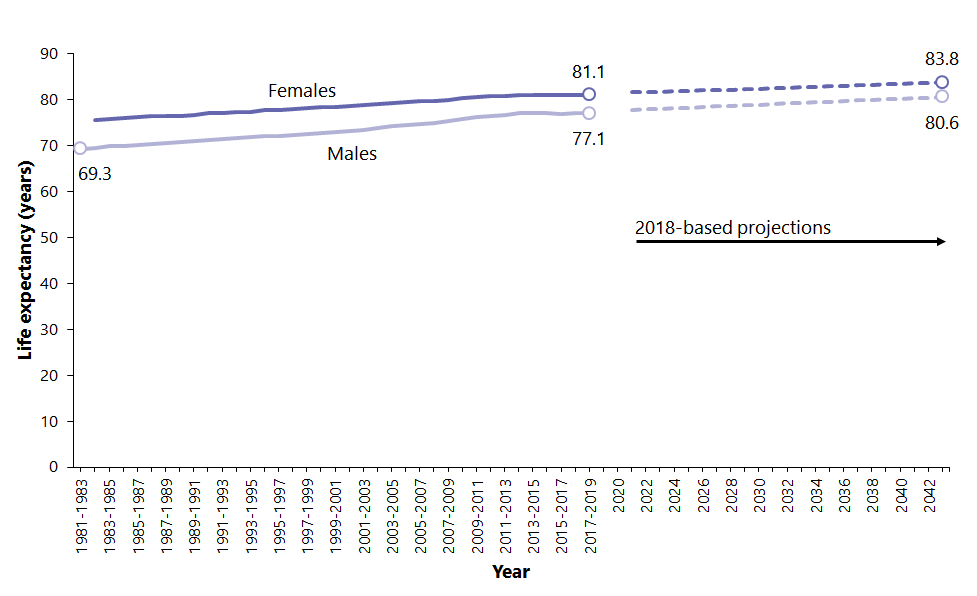
Figures to 2017-2019 are three year life expectancies from the National Life tables for Scotland (NRS). Figures from 2020 onward are projected single year life expectancies from the 2018-based population projections (ONS).
Life expectancy at older ages in Scotland
As well as looking at life expectancy at birth, we can look at the life expectancy for those who have already survived to older ages. In 2017-2019, a man aged 65 in Scotland could expect to live for another 17.7 years on average, 5.3 years longer than they would have done in 1981-1983. A woman of the same age could expect to live 19.8 more years in 2017-19, 3.8 years longer than in 1981-1983. At age 85, men could expect to live for a further 5.7 years and women for a further 6.4 years in 2017-2019, 1.4 and 1.2 years longer respectively than in 1981-1983.
What is ‘period’ life expectancy?
All of the estimates presented in this chapter are ‘period’ life expectancy. They are calculated assuming that mortality rates for each age group in the time period (here 2017-2019) are constant throughout a person’s life. This means that future changes in things such as medicine and legislation are not taken into consideration. While this means that period life expectancy is not an accurate prediction of how long a person will actually live, it is a useful measure of population health.
Recent changes in Scottish life expectancy
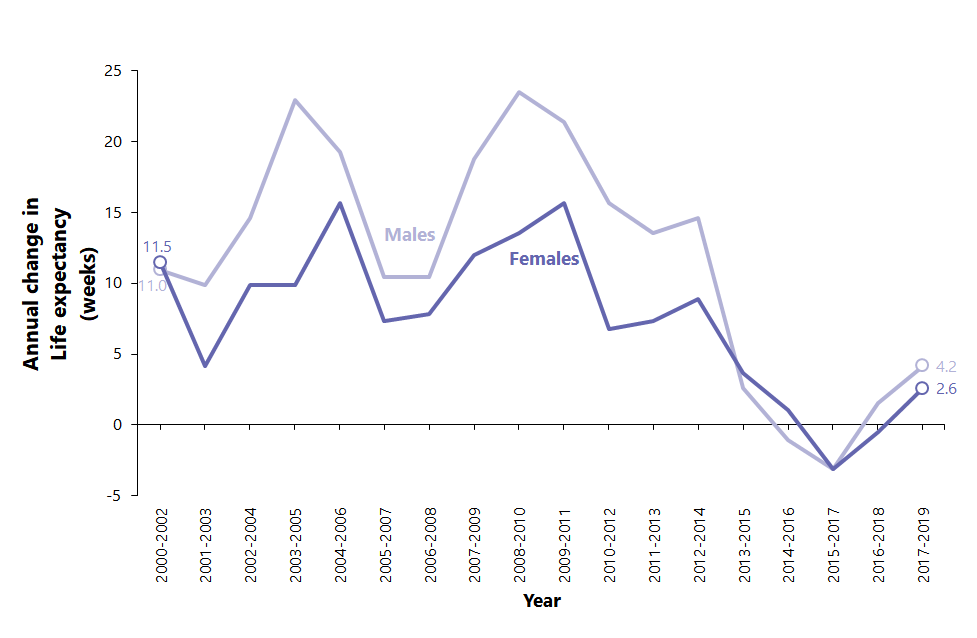
Although life expectancy in Scotland has increased over the long term, in recent years this growth has slowed and stalled. Figure 5.2 shows that between 2000-2002 and 2012-2014, life expectancy grew by an average of 9.9 weeks every year for females and 16.3 weeks every year for males. However, after 2012-2014, life expectancy grew by an average of 0.7 weeks per year for females and 0.8 weeks per year for males. This means that life expectancy in Scotland has remained virtually unchanged from 2012-2014 to 2017-2019.
Figure 5.2: Annual change in life expectancy at birth in Scotland, 2000-2002 to 2017-2019, males and females
Why has life expectancy in Scotland stopped increasing?
NRS has been involved in a collaborative project with a range of health organisations to investigate why life expectancy has stopped increasing. We found that since 2012-2014, there has been a slowdown in the rate of improvement of deaths from heart disease, especially in people aged between 55 and 74. There has also been an increase in the number of younger people aged 35-54 dying from drugs and in people over 75 dying from dementia. More analysis on this can be found in our blog post.
Life expectancy across Europe and the UK
Life expectancy has increased for all countries in the European Union and the UK since the early 1980s. The majority of countries have seen a slowdown in life expectancy growth since 2012-2014. In most cases this was not to the same extent as seen in Scotland and the rest of the UK. Figure 5.3 shows how life expectancy in Scotland compares with EU countries. You can see that life expectancy in Scotland is lower than any other country in western Europe (the EU14 countries, indicated by solid grey lines).
Figure 5.3: Life expectancy at birth in EU countries 1980-1982 to 2017-2019
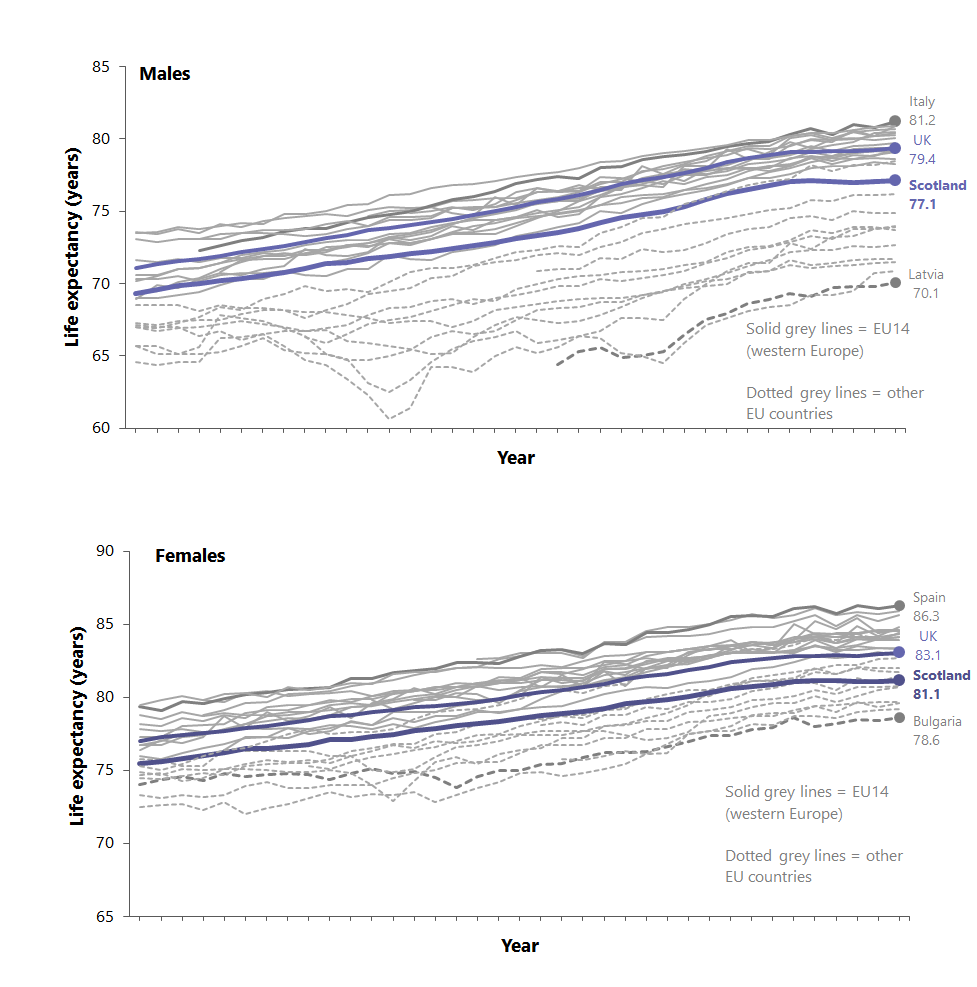
Source: National life tables for Scotland (NRS), National life tables for the UK (ONS), Eurostat (tps00025)
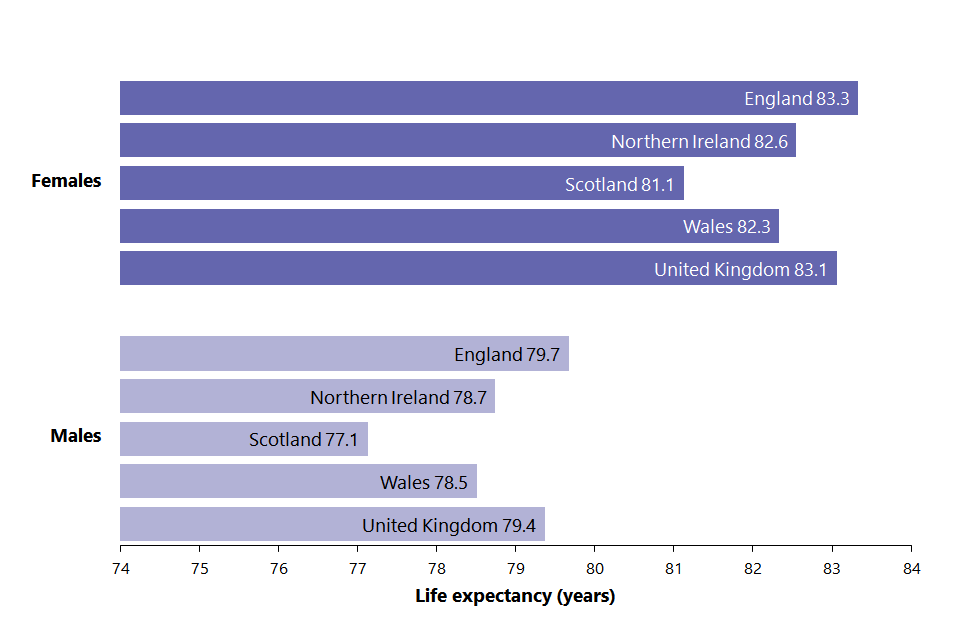
Scotland has the lowest life expectancy of all UK countries for both males and females. Figure 5.4 shows that average life expectancy at birth in the UK was 83.1 years for females and 79.4 years for males in 2017-2019. This is higher than the Scottish figure by 2.2 years for females and 1.9 years for males.
Figure 5.4: Life expectancy in the United Kingdom and constituent countries, 2017-2019, males and females
Life expectancy in council areas
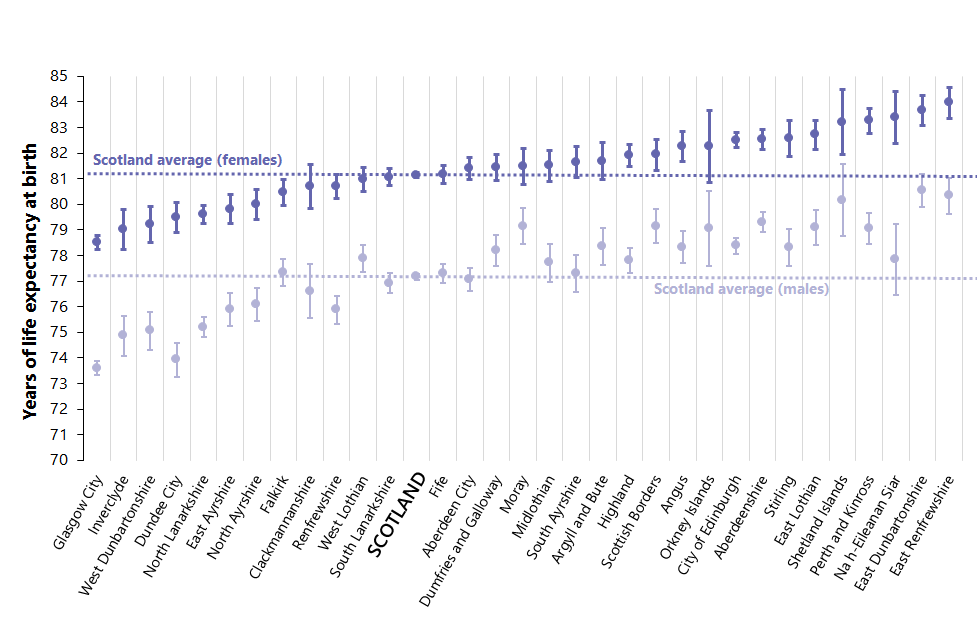
Figure 5.5 shows that the council area where life expectancy at birth was highest for females was East Renfrewshire. Here, a girl born in 2017-2019 could expect to live for 84.0 (±0.6) years. The council area where life expectancy was highest for males was East Dunbartonshire, where a boy born in 2017-2019 could expect to live for 80.5 (±0.6) years. In contrast, life expectancy was lowest in Glasgow City, where females could expect to live for 78.5 (±0.3) years and males for 73.6 (±0.3) years. This represents 5.5 fewer years of life for females and 6.9 fewer years of life for males compared with East Renfrewshire and East Dunbartonshire respectively.
Figure 5.5: Life expectancy at birth in council areas with 95% confidence intervals (ordered by female life expectancy)
How reliable are the life expectancy estimates?
NRS publish 95% confidence intervals around life expectancy in smaller areas - this helps us to understand how accurate the estimates are.
For example, males in Midlothian have a life expectancy of 77.7 and the confidence intervals are 77.0 and 78.4. This means that there is a 95% chance that the ‘true’ value lies between 77.0 and 78.4 and the most likely value is 77.7. This is often written as the value plus or minus the confidence interval: 77.7±0.7 years.
Life expectancy figures for smaller populations have larger confidence intervals. For example, Orkney Islands, which has a relatively small population, has quite a large confidence interval of ±1.5 years for males. In contrast, Glasgow City, which has a much larger population, has a smaller confidence interval of ±0.3 years for males, as the figures will be more precise for larger populations.
We say that the difference between two values is statistically significant if their confidence intervals do not overlap with each other.
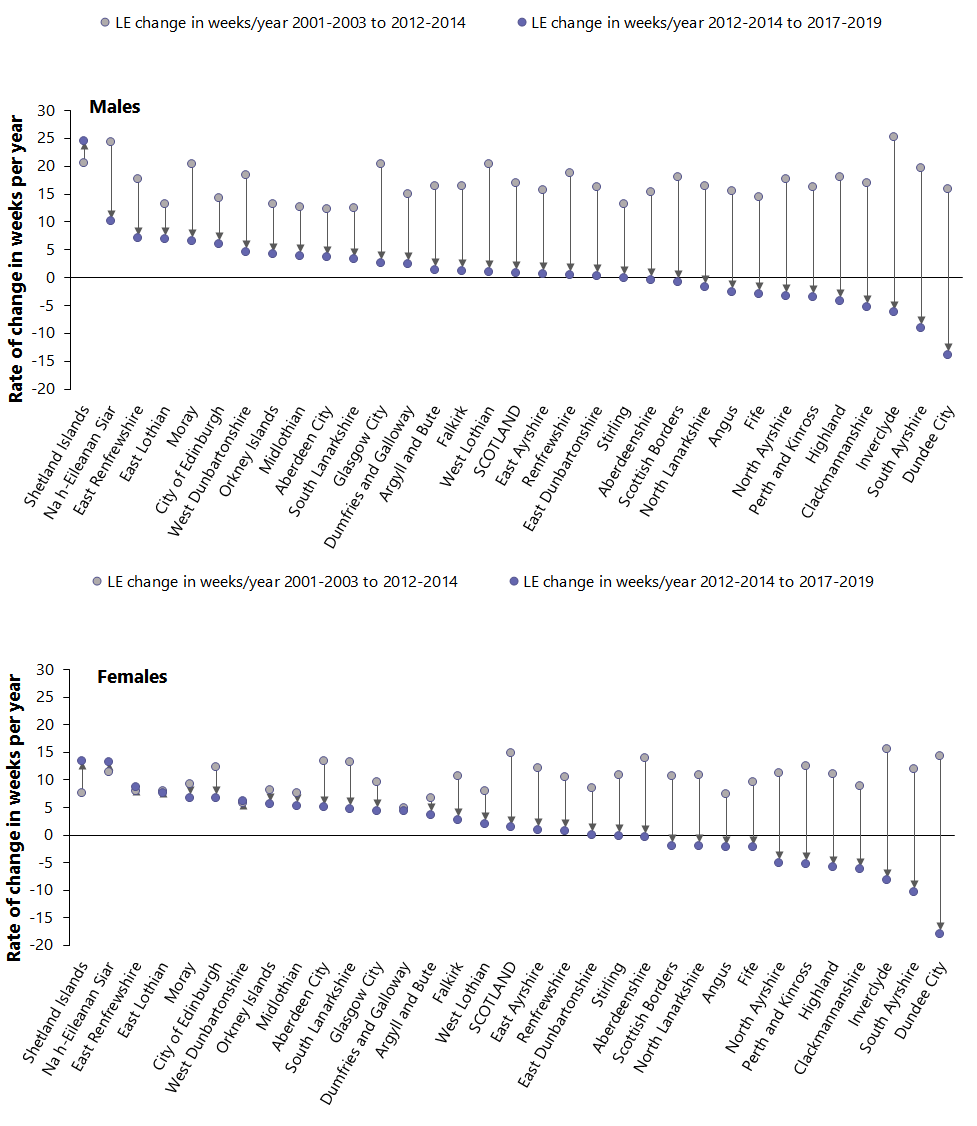
As can be seen in Figure 5.2, the improvements in life expectancy have stalled over the last few years in Scotland. This trend has been seen across Scotland, however, in some areas the change has been greater than others. Figure 5.6 shows that in some council areas, for example Dundee City and Inverclyde, the rate of growth has fallen dramatically since 2012-2014. Figure 5.6 also shows that while some council areas have seen modest increases in the rate of change (for example, Shetland Islands), the vast majority of areas are now experiencing a slower rate of growth in life expectancy and many areas now have decreasing life expectancy.
Figure 5.6: Rate of change in life expectancy, by council area, males and females
Why are there two male life expectancy estimates for Scotland?
The headline life expectancy figure is calculated using single year of age data. However, life expectancy for areas within Scotland is calculated using 5 year age groups (‘abridged life tables’). We also produce a Scotland level estimate using abridged life tables so that it can be properly compared with subnational life expectancy.
So, if we want talk just about Scottish life expectancy (as in figure 5.1), we use the figure from the figure derived from single year data. If we are comparing with subnational life expectancy (as in figure 5.5), we use the abridged life tables. The figures are always very similar, but this year male life expectancy at birth rounds to 77.1 in the national life tables and 77.2 in the abridged life tables. The equivalent female figures round to the same number (81.1)
Life expectancy and deprivation
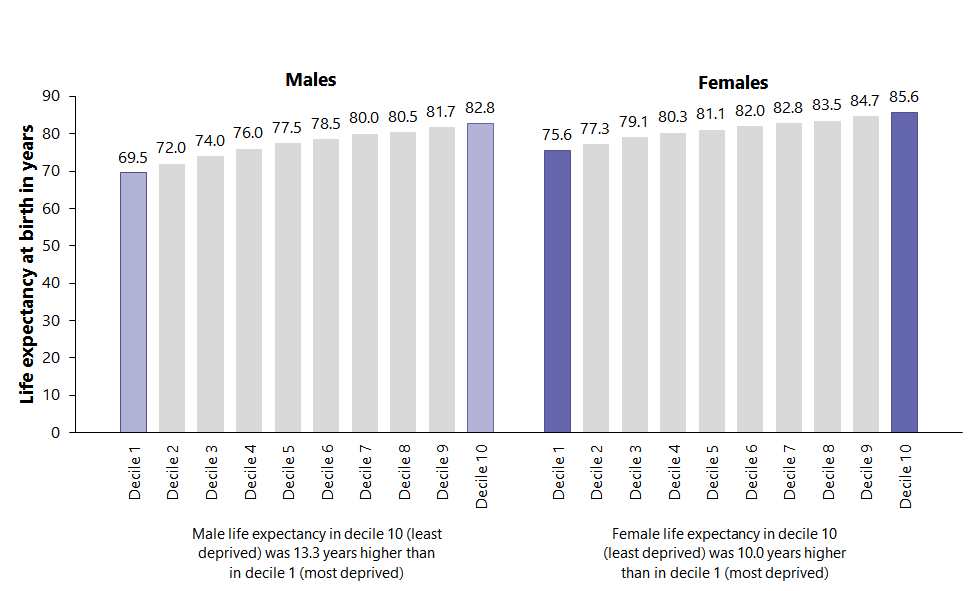
While life expectancy varies between geographical areas like council areas and health boards, the difference in life expectancy is far greater when we split Scotland by deprivation. Figure 5.7 shows life expectancy at birth in SIMD (Scottish Index of Multiple Deprivation) deciles. For males born in 2017-2019, life expectancy at birth was 69.5 (±0.3) years in deprivation decile 1 (the 10% most deprived areas) compared with 82.8 (±0.3) years in decile 10 (the 10% least deprived areas), a gap of 13.3 years. For females born at the same time, life expectancy was 75.6 (±0.3) years in decile 1 and 85.6 (±0.2) years in decile 10, a gap of 10.0 years.
Figure 5.7: Life expectancy at birth by SIMD decile 2017-2019