Chapter 9: Households and Housing
“In 2019 there were 2.50 million households in Scotland, 6.1% more than in 2009.””
Households and COVID-19
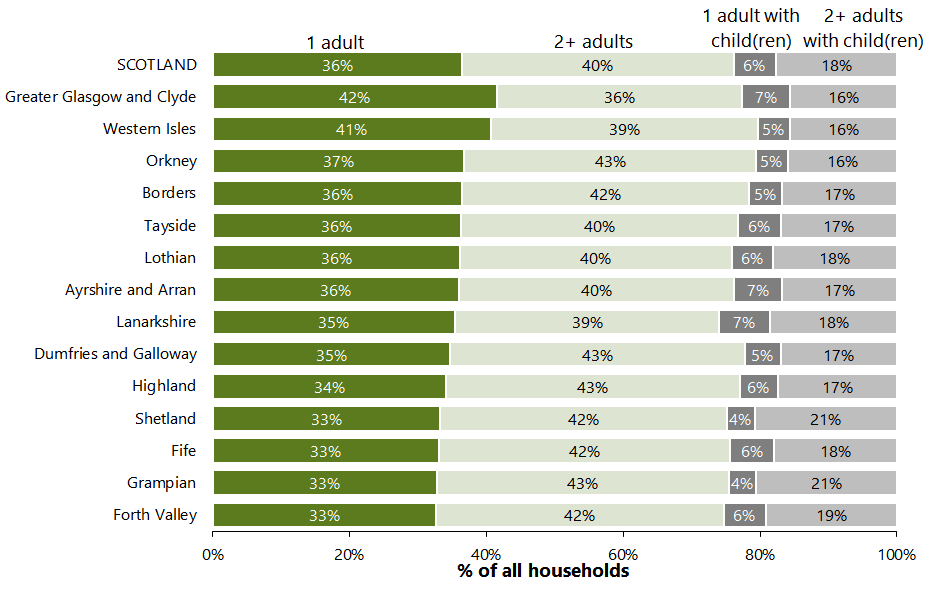
The statistics included in this chapter relate to the estimated number of households as at 30 June 2019 and to 2018-based projections of households numbers. So they do not take into account the impact of COVID-19, but they can be helpful for understanding some of the impacts of the pandemic. For example, people living alone may have found self-isolation especially difficult. The 2018-based household projections indicate that about 1 in 5 people live alone. Single person households makes up over a third of Scotland’s households. Older people are more likely to live alone: in the 70 and over age group, nearly 1 in 2 women live alone, and around 1 in 4 men do. Households containing children will have been affected by the school and nursery closures - nearly a quarter of households contain children under the age of 16. These projected figures can be seen in Figure 9.1.
Figure 9.1: Household structure of each Health Board in September, 2020
Links to other useful data on households:
- Open data (of household projections) showing the number of households by household type and age of household structure in each council area.
- Check out our blog for more information about the range of NRS statistics that are useful for understanding COVID-19.
- Research published by the Centre for Population Change analysing household vulnerability – on dimensions of health, employment, housing, finance and digital - to the effects of COVID-19 by household type.
- Household estimates and projections – reports, charts and data
- Open data – household estimates based on Council Tax data which show the proportion of households which receive single adult discounts. Most are households containing one adult or one adult with children. This can also be viewed as a map.
Scotland’s households: past, present and future
There were 2.50 million households and 2.64 million dwellings in Scotland in 2019. Over the last 10 years the number of households in Scotland has grown by 143,800 (6.1%), and it is projected to continue growing to 2.60 million in 2028 and to 2.71 million by 2043, see Figure 9.2. The household projections (which are based on past trends) project the number of households in Scotland increasing on average by around 12,000 per year between 2018 and 2028 and by 7,800 between 2028 and 2043.
A ‘household’ refers to a group of people living together in a dwelling. This could be one person living alone, or a group of people who may or may not be related to each other.
The number of households in Scotland is projected to increase by 5% between 2018 and 2028. The corresponding percentage increase is 7% in England, 4% in Wales and 4% in Northern Ireland.
Figure 9.2: Number of households in Scotland, 2018, 2028 and 2043
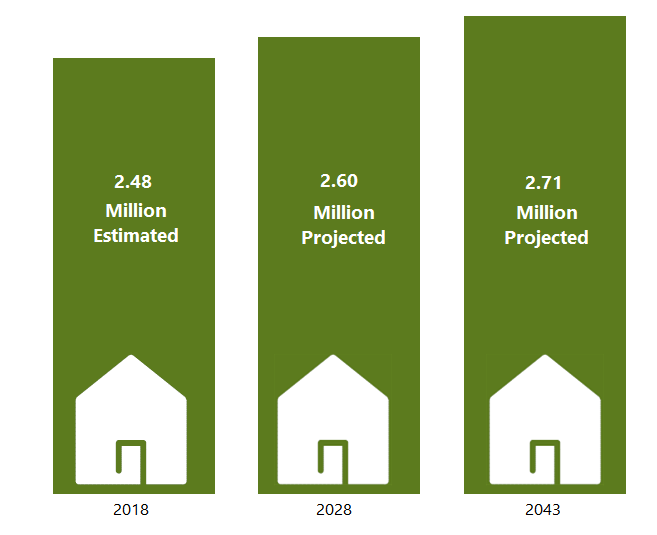
Source: National Records of Scotland (NRS) Household Estimates (2019), Household Projections 2018-based
Over the last decade the number of households increased faster than the population (6.1% compared to 4.4%) - see Figure 9.3.
The growth in households has been faster than the population growth because people are increasingly living alone or in smaller households. One person households have become the most common type in recent years. The number of single person households comprised of males aged 30 to 64 has also increased relative to the population in this group (Figure 9.4).
The average household size (number of people per household) has been on a downward trend for many years, although recently the rate of decrease has been slower. However, there are some exceptions across Scotland – the average household size has been increasing in Edinburgh and Glasgow (4.7% and 5.0% increase from 2009 to 2019).
Figure 9.3: Trends in households and population, mid-2009 to mid-2019
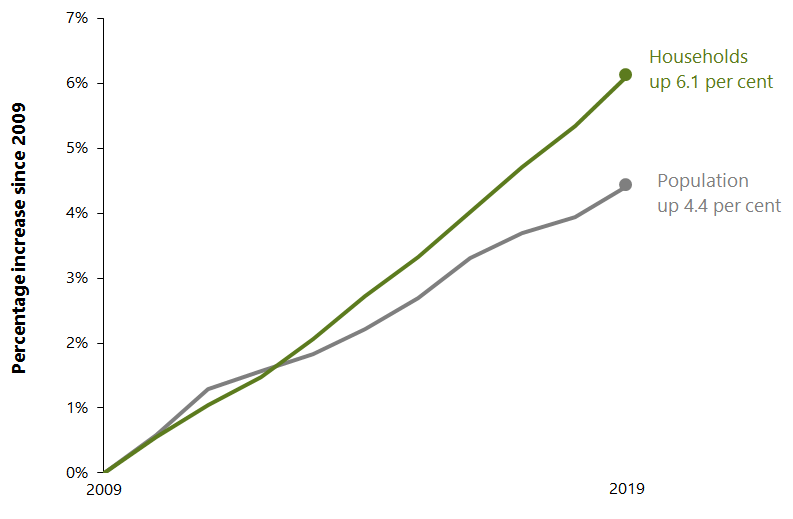
Source for population: National Records of Scotland Mid-Year Population Estimates
Figure 9.4: Percentage of people living alone in Scotland by age and sex, 2019
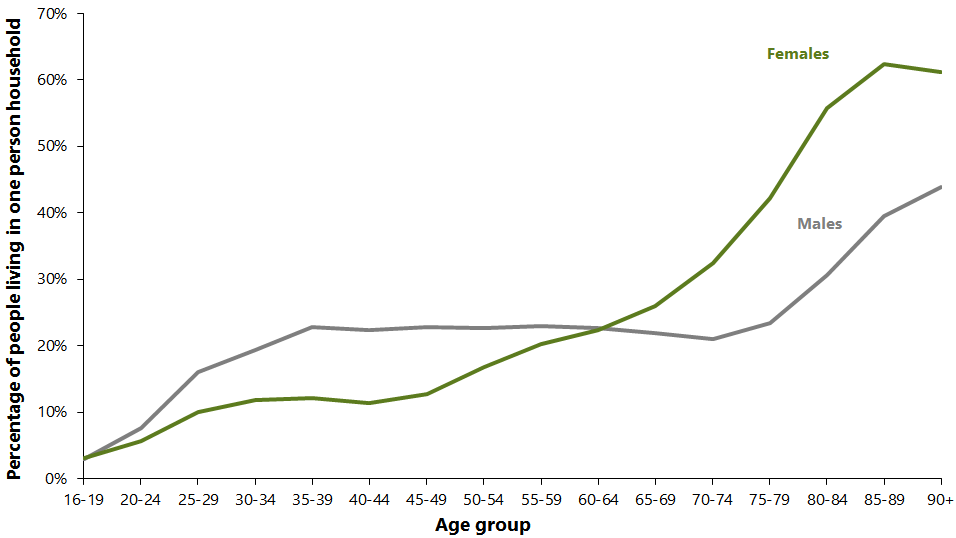
Numbers are given as a percentage of adults in age group, not as a percentage of households. Source: National Records of Scotland (NRS): Household projections, 2018-based.
Over the last decade, the average household size fell from 2.18 people per household in 2009 to 2.15 people per household in 2019. This is projected to fall further to 2.08 people per household by 2028 and to 2.00 by 2043. These changes are partly due to the ageing population, as elderly people are more likely than younger people to live alone or with just one other person.
The split by sex of people living alone is now close to 50:50. The proportion of people living alone who were female fell from 70% in 1981 to 51% in 2019. The higher number of females living alone is mainly due to females outliving their partners. Figure 9.5 shows the number of single person households by sex.
Figure 9.5: Number of women and men living alone in 1981 and 2019
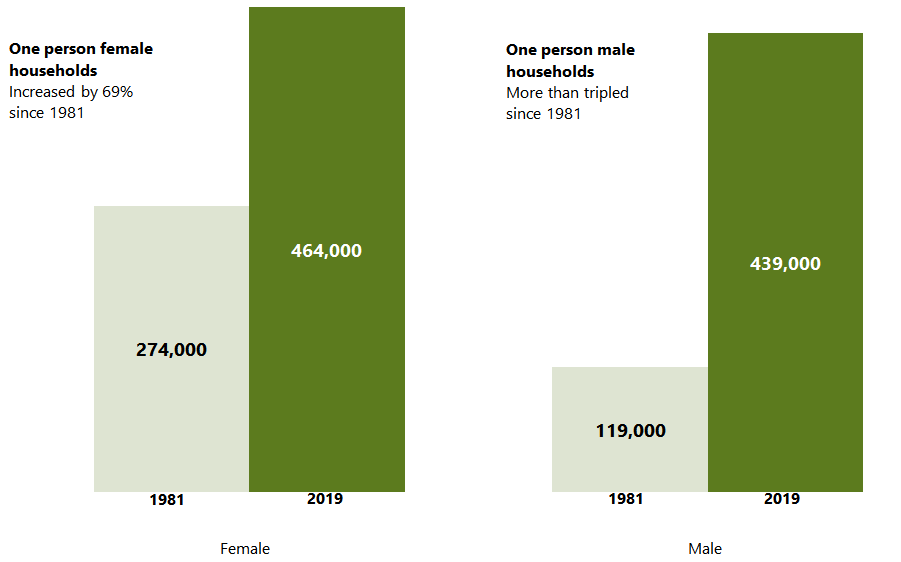
Source: Scottish Household Survey, National Records of Scotland (NRS), Household Projections 2018-based
Projected changes in household type
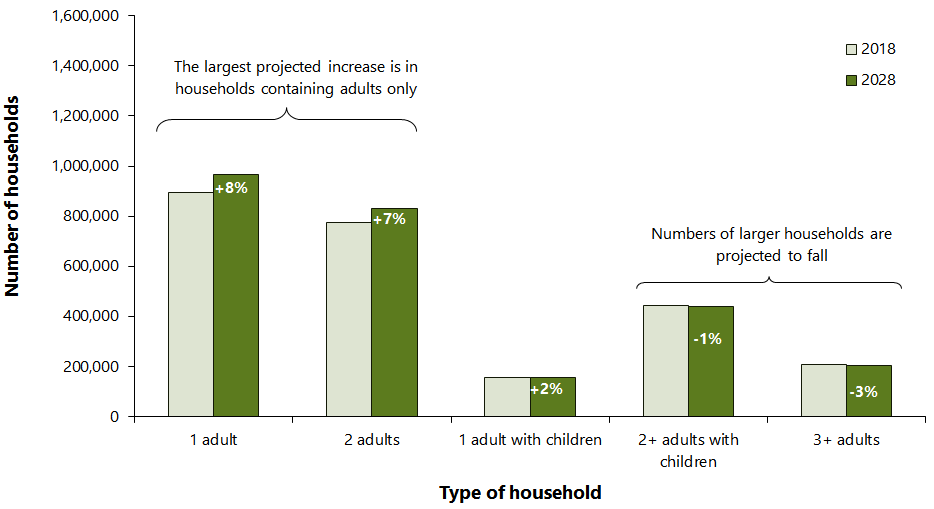
The numbers of some household types are projected to increase more than others by 2028, as illustrated in Figure 9.6.
The largest projected increase in households (in both number and percentage terms) is for those which contain one person only. As a proportion of all households, single person households are projected to increase from 36% in 2018 to 37% in 2028 and to 38% in 2043. The number of households containing two adults only is projected to rise, while the numbers of larger households are projected to fall slightly.
Figure 9.6: Households in Scotland by household type: 2018 and 2028
Source: National Records of Scotland, Household Projections 2018-based
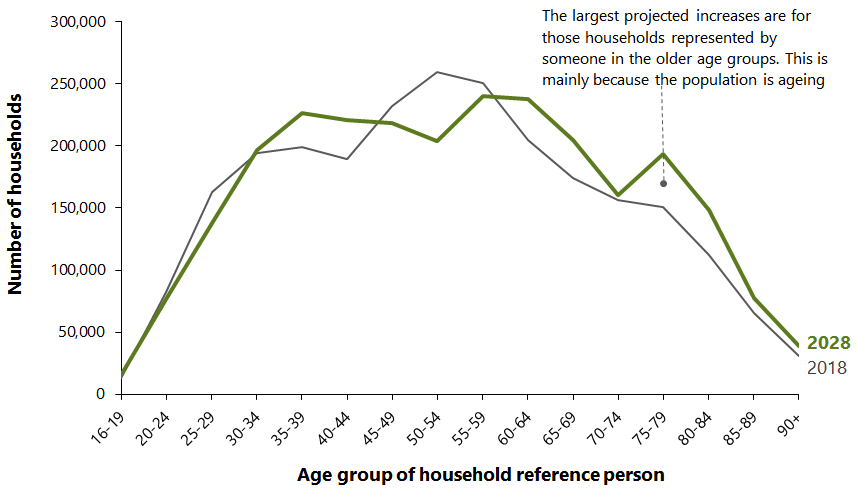
Projected changes by age group
Figure 9.7 shows the projection of the number of households from 2018 to 2028, by the age of the household reference person (HRP). The number of households with older HRPs is projected to rise, reflecting the ageing population in Scotland. The number of households where the HRP is someone aged 65 or over is projected to increase from 689,600 in 2018 to 824,300 in 2028 (an increase of 20%) and to 965,700 in 2043 (an increase of 40% compared with 2018).
The household projections use the 2011 Census definition of a household reference person (HRP); that is the eldest economically active person in the household, then the eldest inactive person if there was no economically active person.
Figure 9.7: Households in Scotland by age of household reference person: 2018 and 2028
Source: National Records of Scotland, Household Projections 2018-based
A total of 342,900 people aged 65 or over were estimated to be living alone in 2018. This number is projected to rise to 405,500 in 2028 (an increase of 18%) and to 488,300 by 2043 (an increase of 42%). This is mainly due to the growth in the number of older people, rather than because the proportion of older people living alone is changing. Increases are particularly large in the oldest age groups (85 or over) where the number of people living alone is projected to rise from 67,200 in 2018 to 81,400 in 2028 (an increase of 21%), and to 124,700 by 2043 (an increase of 85%).
Household numbers across Scotland
The number of households has grown in every council area over the 10 years to 2019. The areas with the greatest increase in households in percentage terms have been:
- Midlothian (an increase of 15.6%, 5,400 households)
- Orkney Islands (an increase of 11.3%, 1,100 households)
- East Lothian (an increase of 10.8%, 4,600 households).
City of Edinburgh has seen the largest increase in terms of absolute numbers (17,800 households, an increase of 8.1%).
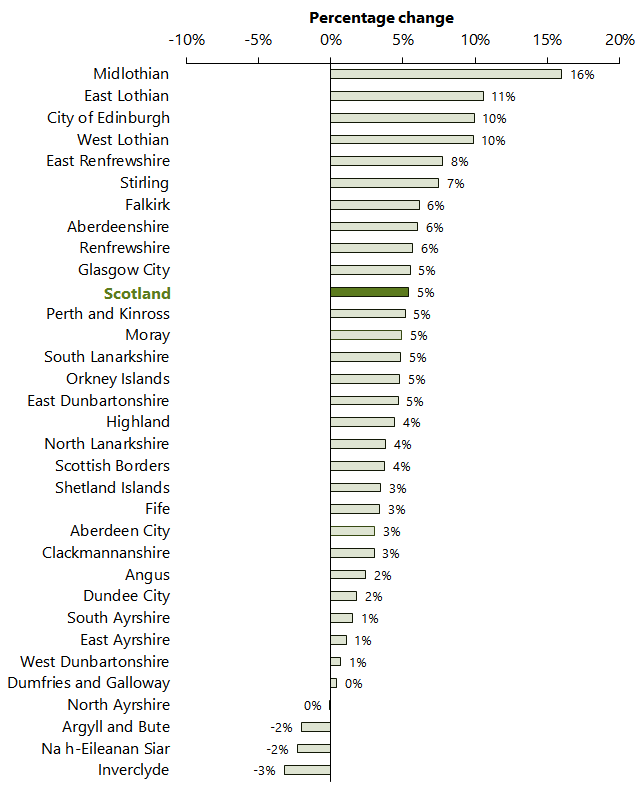
The number of households is projected to increase in almost every council area between 2018 and 2028, as shown in Figure 9.8. The largest percentage projected increases are in:
- Midlothian (16%)
- East Lothian (11%)
- City of Edinburgh (10%)
- West Lothian (10%).
In contrast, household numbers are projected to fall between 2018 and 2028 in:
- Inverclyde (3%)
- Argyll and Bute (2%)
- Na-h Eileanan Siar (2%)
- North Ayrshire (0.1%).
Over a longer projection period (2018 to 2043) the numbers of households are also projected to fall in:
- West Dunbartonshire (0.9%)
- Dumfries and Galloway (0.8%)
- East Ayrshire (0.3%).
Figure 9.8: Projected percentage change in the number of households by council area, 2018 to 2028
Source: National Records of Scotland (NRS) Household Estimates (2019), Household Projections 2018-based (2028)
More detailed information about Scotland’s households can be found in the Households section on the National Records of Scotland website. Statistics on housing in Scotland are available from the Housing and Regeneration Statistics page of the Scottish Government website.
A cross-government working group on housing statistics exists to provide an improved coherent picture of the UK housing landscape for users of statistics on this topic. Further information on the work of this group is available on the Government Statistical Service website.
Vacant dwellings and second homes
Across Scotland, just under 96% of dwellings were occupied in 2019, while 3.2% of dwellings were vacant and 0.9% were second homes. Remote rural areas had the highest percentage of dwellings that were vacant or second homes (5.5% and 6.3% respectively, compared to 2.9% and 0.4% in large urban areas).
The areas with the highest proportion of second homes are:
- Earlsferry, Fife (53%)
- Largs Central and Cumbrae, North Ayrshire (41%)
- Elie, Fife (33%).
See our publication on Small area statistics and our interactive map to discover other places of interest. Over the past four years, the number of vacant dwellings has increased very slightly, from 78,500 (3.1% of total dwellings) in 2015 to 84,600 (3.2%) in 2019. Over the same period the number of second homes has been steadily decreasing, from 27,300 (1.1% of total dwellings) in 2015 to 24,500 (0.9%) in 2019.
Households vs. Dwellings – what’s the difference?
A ‘dwelling’ refers to the accommodation itself, for example a flat or house.
A ‘household’ refers to a group of people living together in a dwelling.
The number of dwellings in an area includes second homes and vacant dwellings; some dwellings may contain more than one household.
How are household statistics used?
Household estimates and projections are used by central government, councils and others for a variety of purposes, including:
- informing councils about housing need and provision of services (including housing, waste collection and community care)
- land use allocation and planning
- assessing demand for water and sewerage services
- risk analysis by Fire and Rescue Services