National Records of Scotland

Preserving the past, Recording the present, Informing the future

2014

Household numbers projected to rise in most areas

Wednesday, 26 Nov 2014
Demography News Release - Image

Figures published today by the National Records of Scotland (NRS) show projected rates of household change in the regions around Scotland’s biggest cities, and in the National Parks.

Tim Ellis, the Chief Executive of National Records of Scotland, said:

“Scotland’s population is ageing, and the effect of this is greater in rural areas such as the National Parks. By 2037, around half of households in Scotland’s National Parks are projected to be headed by someone aged 65 or over, compared to around a third of households in Scotland as a whole.” 

The figures show that the number of households is projected to grow in the regions around Scotland’s biggest cities of Aberdeen, Dundee, Edinburgh and Glasgow, where around three quarters of the population of Scotland live. The projected growth over the next 25 years ranges from 13 per cent in Glasgow & Clyde Valley to 28 per cent in Aberdeen City & Shire.

Over the same period, the number of households is also projected to increase in Cairngorms National Park (by 12 per cent). However, the number of households in Loch Lomond & The Trossachs National Park is projected to fall by four per cent.

The full publication 'Household Projections for Scotland’s Strategic Development Plan Areas and National Parks (2012-based)' is available on this website.
 

Tags: 

The Kaiser's Spy in Scotland

Friday, 14 Nov 2014
The Kaiser's Spy in Scotland - Image

A secret agent’s spy kit goes on display for the first time at the National Records of Scotland in an exhibition on German espionage in Scotland before the First World War. The exhibition tells the story of Dr Armgaard Karl Graves, who undertook a secret mission to Scotland in 1912 under orders from Berlin to obtain vital information about the Royal Navy’s latest weaponry and strength. The exhibition uses intercepted documents and items seized from Graves to demonstrate how MO5, the forerunner of MI5, carried out its surveillance and capture of foreign agents.

‘The Kaiser’s Spy in Scotland: Naval espionage before the Great War’ is on show at General Register House, 2 Princes Street, Edinburgh, from 14 November until 9 January 2015 (except 25-26 December 2014 and 1-2 January 2014), Monday – Friday 9:00 – 4:30, entry free.

Tags: 

Census 2011: Release 3K

Thursday, 6 Nov 2014
Demography News Release - Image

Detailed characteristics on Housing and Accommodation in Scotland

The statistics published today by the Registrar General for Scotland on the Scotland’s Census  website present further details on housing and accommodation (Release 3K), from national to local level.

Key points - Release 3K

Living arrangements of full-time students by tenure by age

  • At the time of the 2011 Census, just over half (52 per cent) of the 361,000 schoolchildren and full-time students aged 16 and over in Scotland lived with their parents. A further 17 per cent lived in all-student households, 6 per cent lived alone, 10 per cent in a household with their spouse, partner and/or children, 5 per cent in other types of households and 10 per cent in communal establishments such as university halls of residence.
  • The proportion of students who lived with their parents decreased with age: it was 96 per cent for those aged 16 or 17 and 10 per cent for those aged 25 and over.
  • Almost three quarters (74 per cent) of the 186,000 schoolchildren and full-time students aged 16 and over who lived with their parents were in households that owned their property. In contrast, 87 per cent of the 63,000 people in all-student households lived in private rented accommodation, while this proportion was 56 per cent for the 22,000 students who lived alone. The proportion of students who lived in communal establishments was highest for those aged 18 or 19, at 21 per cent.

Length of residence in the UK by number of rooms

  • A total of 348,000 people living in households in Scotland in 2011 were born outside the UK. The proportion of these people in households occupying five or more rooms increased with length of residence in the UK: it was 37 per cent for those resident for less than two years and 66 per cent for those resident for ten years or more.

Tenure by occupancy rating [Footnote 1] by household composition

  • In 2011, 9 per cent (214,000) of the 2.4 million household spaces in Scotland had an occupancy rating of -1 or less, implying they were overcrowded based on the notional number of rooms required for the people who lived there. This proportion was 5 per cent (67,000) for households who owned their property, 16 per cent (93,000) for households in social rented accommodation and 17 per cent (54,000) for households in private rented accommodation.
  • Of households comprising a family with dependent children, the proportion which were overcrowded was 23 per cent (33,000) for households in social rented accommodation and 17 per cent (13,000) for households in private rented accommodation.
  • Just over a third (35 per cent or 17,000) of households in the ‘other household type’ category in private rented accommodation were overcrowded. The corresponding proportion for social rented accommodation was 43 per cent (10,000 households).  (The ‘other household type’ category includes households with two or more usual residents and comprising all-student households,  one family with others – e.g. more than two generations living together - or households of unrelated adults.) 

Household composition by type of central heating in household

  • In 2011, 2 per cent of the 2.4 million households in Scotland had no central heating. This proportion was slightly higher for persons aged under 65 living alone (5 per cent) and for all-student households (4 per cent).

Central heating by occupancy rating and ethnic group of Household Reference Person

  • In 2011, the proportion of households with no central heating was 5 per cent  for overcrowded households. It was also 5 per cent for households where the Household Reference Person was from a minority ethnic group.

Tables included in Release 3K

DC1402SC

Living arrangements by tenure by age of student

DC1403SC Household composition by type of central heating in household
LC1403SC Household composition by type of central heating in household
DC2410SC Length of residence in the UK by number of rooms
LC2410SC Length of residence in the UK by number of rooms
DC3403SC General health by long-term health problem or disability by occupancy rating (rooms) by age
LC3403SC General health by long-term health problem or disability by occupancy rating (rooms)
DC4104SC Tenure by occupancy rating (rooms) by household composition
LC4104SC Occupancy rating (rooms) by household composition
DC4106SC Tenure by occupancy rating (rooms)
LC4106SC Tenure by occupancy rating (rooms)
DC4304SC Type of central heating in household by general health by long-term health problem or disability
LC4304SC Type of central heating in household by general health by long-term health problem or disability
LC4404SC Tenure by household size by number of rooms
DC4406SC Tenure by number of persons per room in household by accommodation type
LC4406SC Tenure by number of persons per room in household by accommodation type
DC4410SC Type of central heating in household by occupancy rating (rooms) by age
LC4410SC Type of central heating in household by occupancy rating (rooms) by age
DC4418SC Type of central heating in household by occupancy rating (rooms) by ethnic group of Household Reference Person (HRP)
LC4418SC Type of central heating in household by occupancy rating (rooms) by ethnic group of Household Reference Person (HRP)
DC4420SC Type of central heating in household by occupancy rating (rooms) by ethnic group
LC4420SC Type of central heating in household by occupancy rating (rooms) by ethnic group
DC4426SC Tenure by type of central heating in household by household composition
LC4426SC Tenure by type of central heating in household by household composition
LC4601SC Tenure by economic activity – Household Reference Persons (HRPs)
LC4605SC Tenure by National Statistics Socio-economic Classification (NS-SeC) – Household Reference Persons (HRPs)
DC6216SC Industry by ethnic group by sex
LC6604SC Occupation by industry

All the data contained in this release can be accessed on the Scotland’s Census website.

Footnote

  1. Occupancy rating provides a measure of whether a household’s accommodation is overcrowded or under-occupied in relation to the notional number of rooms required by those who live there. An occupancy rating of -1 means that there is one room too few for the people living in the household. In contrast, an occupancy rating of +1 means that there is one room more than required for the people living in the household. The occupancy rating is calculated by subtracting the notional number of rooms required from the actual number of rooms. In deriving the notional number of rooms a household requires, a standard formula is used which takes account of the ages of the household members and their relationships to each other. Further details on the standard formula are provided on the Scotland's Census website.
Tags: 

Winter Mortality in Scotland - 2013-14

Wednesday, 29 Oct 2014
Demography News Release - Image

The number of deaths registered in Scotland during winter 2013/14 was the lowest since records began more than 60 years ago.

Figures released today by the National Records of Scotland (NRS) show there were 18,675 deaths registered in Scotland in the four months to March 2014. This was the lowest number of deaths registered in Scotland in the winter since records began in 1951/52.

The 18,675 deaths registered in the four winter months of 2013/14 exceeded both the 16,848 deaths in the preceding four-month period and the 17,297 deaths in the following four-month period.

The seasonal difference (comparing the four winter months with the average of the four-month periods before and after the winter, and rounding the result) was 1,600 for winter 2013/14. This was about 400 below the corresponding figure of 2,000 for winter 2012/13, and the second lowest figure of any of the 63 winters for which these statistics have been produced (the 1,420 for winter 2011/12 was the lowest value).  The last fourteen winters have had seven out of the ten lowest figures in the 63 winters for which these statistics are available.

Commenting on ‘Winter Mortality in Scotland - 2013/14’, Tim Ellis, Chief Executive of the National Records of Scotland, said:

"There are always more deaths in the winter in Scotland than in any other season, but last winter had the second lowest seasonal increase in all the years, since 1951/52, for which we have figures.

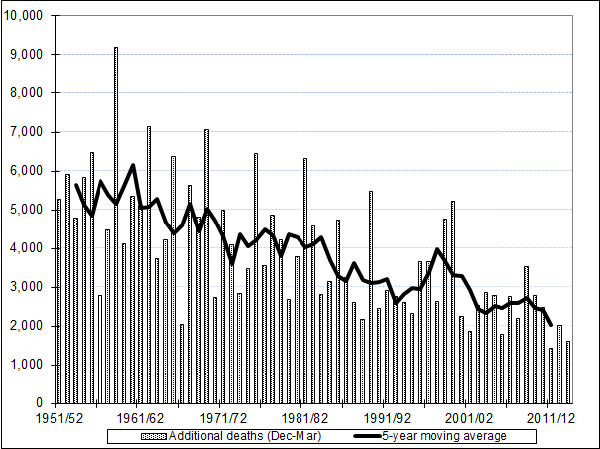
"The long-term trend over the last 60 years or so has clearly been downward. The five-year moving average, which smoothes out much of the year-to-year fluctuation, is at its lowest ever level.

"There is no single cause of additional deaths in winter. Very few are caused by hypothermia and only a small proportion by influenza. Most are from respiratory and circulatory diseases such as pneumonia, coronary heart disease and stroke.”

Seasonal Increase in Mortality in the Winter, Scotland, 1951/52 to 2013/14

Seasonal Increase in Mortality in the Winter, Scotland, 1951/52 to 2013/14 - Image

The full publication ‘Winter Mortality in Scotland 2013/14’ is available on the NRS website.

Tags: 

Updates on Same Sex Marriage in Scotland

Thursday, 23 Oct 2014
Registration News Release - Image

 “The Scottish Government announced on Monday 13 October 2014 plans for commencing most of the rest of the Marriage and Civil Partnership (Scotland) Act 2014 (including same sex marriage; changing existing Scottish civil partnerships to marriage and the provisions on gender recognition).  The “go live” date will be 16 December.   This means that:

  • Same sex couples will be able to give notice of intention to marry on 16 December – the relevant updated Marriage Notice form will be available in due course.
  • The first marriage ceremonies of same sex couples could take place on 31 December, after the usual clear 14 day notice period has expired and subject to the usual checks (e.g. on divorces of any previous marriages). You should contact the local registrar about your plans at the earliest opportunity.
  • The first changes of civil partnerships registered in Scotland to marriages through the administrative route in Scotland could take place on 16 December.  Again the relevant application form will be available in due course. However, you should make an appointment to speak to the local registrar about your plans at the earliest opportunity. 
  • Same sex couples will be able to give notice of intention to enter a religious or belief civil partnership on 16 December – the relevant updated Civil Partnership Notice form will be available in due course.
  • From 16 December, people in a marriage solemnised in Scotland will be able to apply to the Gender Recognition Panel and obtain a full Gender Recognition Certificate without the need for divorce.

 All this is subject to Parliamentary approval of an Order under the section 104 of the Scotland Act 1998 at the UK Parliament and the associated Scottish Statutory Instrument at the Scottish Parliament.”


Tags: 

Scottish Government Report - Analysis of Equality Results from the 2011 Census

Wednesday, 22 Oct 2014
Demography News Release - image

This Scottish Government report adds value to equality data from Scotland’s Census published by National Records of Scotland. It brings together relevant data from the census and other sources, and uses infographics to paint a picture of equality in Scotland. It is designed to be used by policy makers to evidence policy and Equality Outcomes, target services and help tackle discrimination. Further details are available on Scottish Government website.

Tags: 

Consolidated Tax Schedules for 1798-1799 available online

Thursday, 16 Oct 2014
Image of an extract taken from the Consolidated Tax Schedules for the parish of Inveresk, NRS E326/15/20 page 150.

National Records of Scotland are pleased to announce that we have made the Consolidated Tax Schedules for 1798-1799 available online via the ScotlandsPlaces  website.

In the late-eighteenth century the government of William Pitt the Younger had introduced many individual taxes, including taxes on houses, windows, servants, carriages, carts, horses and dogs. From 1798 onwards the way taxpayers were assessed for these taxes changed, and schedules were drawn up which listed all the taxes due by each taxpayer (NRS reference E326/15).

The surviving rolls for the 27 counties contain details on about 80,000 taxpayers.

These consolidated schedules survive for 1798 to 1799, but only for counties which begin with the letters A-M (so no schedules survive for Nairnshire, Orkney, Peebles-shire, Perthshire, Renfrewshire, Ross-shire  and Wigtownshire).

Access to the Consolidated Tax Schedules on the ScotlandsPlaces site requires a subscription, but the images can be browsed as ‘Virtual Volumes’ in the Historical Search Room at the National Records of Scotland in Edinburgh (free of charge) and in the ScotlandsPeople Centre. They are not yet indexed.

In the example below (E326/15/20 page 150), the Reverend Dr Alexander Carlyle, friend of David Hume and Adam Smith, is listed as one of the people in Inveresk parish liable for the tax. The schedule reveals that he had to pay, amongst others, for 16 windows, 1 male servant, 1 carriage and two horses.

Image of an extract taken from the Consolidated Tax Schedules for the parish of Inveresk featuring Dr Alexander Carlyle, NRS E326/15/20 page 150.


Tags: 

Census 2011: Release 3J

Thursday, 16 Oct 2014
Demography News Release - image

Detailed characteristics on Housing and Accommodation in Scotland

The statistics published today by the Registrar General for Scotland on the Scotland’s Census  website present further details on housing and accommodation (Release 3J), from national to local level. 

Key points

Accommodation type by tenure by number of rooms by household size

  • In 2011, just over a third (35 per cent or 823,000) of households comprised one person, 34 per cent (808,000) two people, 27 per cent (630,000) three or four people and 5 per cent (112,000) five or more people.
  • A quarter (25 per cent) of houses or bungalows were single person households  compared with 52 per cent of flats. In contrast, 6 per cent of houses or bungalows comprised five or more people compared with just 2 per cent of flats.
  • There was a clear association between the number of rooms occupied by a household and the number of people in the household. For example, 30 per cent of houses or bungalows and 26 per cent of flats with six or more rooms comprised four or more people.
  • The proportion of households living in houses and bungalows with four or more rooms available was higher than the proportion for households living in flats, 94 per cent and 63 per cent respectively. Owner occupied houses and bungalows generally had a higher number of rooms: 51 per cent had six or more rooms compared with 10 per cent of social rented houses and bungalows and 32 per cent of private rented houses and bungalows.

Accommodation type by type of central heating in household by tenure

  • Just 2 per cent (55,000) of the 2.4 million households in Scotland reported they had no central heating in the 2011 Census. This proportion was slightly higher for flats (4 per cent) and for households in private rented accommodation (6 per cent). It was lowest for semi-detached houses (1 per cent) and for social rented accommodation (also 1 per cent).

Accommodation type by household spaces

  • The 2011 Census estimated that there were 101,000 unoccupied household spaces in Scotland, 4 per cent of the total of 2.5 million household spaces. Of these unoccupied household spaces, 64 per cent (64,000) were assessed as being vacant, for example new builds or other accommodation awaiting new occupants, and 36 per cent (37,000) were classed as second or holiday homes.
  • Around two thirds (67 per cent) of the unoccupied second or holiday homes were houses or bungalows and the other 33 per cent were flats. Forty nine per cent of unoccupied household spaces assessed as vacant were houses or bungalows and 51 per cent were flats.

National Statistics Socio-economic Classification (NS-SeC) by tenure

  • In 2011, 84 per cent of the 343,000 people in households in Scotland who were aged 16 to 74 and in the NS-SeC category ‘Higher managerial, administrative and professional occupations’ owned their property, including 29 per cent who owned it outright and 56 per cent who owned it with a mortgage or loan. Of the remainder, 3 per cent lived in social rented accommodation and 13 per cent in private rented accommodation.
  • Of the 191,000 people in the NS-SeC category ‘Never worked and long-term unemployed’, over half (57 per cent) lived in social rented accommodation, 27 per cent owned their property and 16 per cent lived in private rented accommodation.
  • In 2011, 61 per cent of the 787,000 people aged 16 to 74 in Scotland who lived in social rented accommodation were in the NS-SeC categories ‘Semi-routine occupations’ (23 per cent), ‘Routine occupations’ (24 per cent) and ‘Never worked and long-term unemployed’ (14 per cent).

Tenure by general health by long-term health problem or disability by age

  • Just under a fifth (19 per cent) of the 5.2 million people living in households in Scotland in 2011 had a long-term health problem or disability which limited their day-to-day activities. This proportion was 16 per cent for people who owned their property, 32 per cent for people in social rented accommodation and 13 per cent for those living in private rented accommodation.
  • In 2011, 5 per cent of all people living in households reported their general health as being ‘bad’ or ‘very bad’. This proportion was higher for those in social rented accommodation (12 per cent) than for those who owned their property or were in private rented accommodation (both 4 per cent).
  • Older people are more likely to have a long-term health problem or disability. The proportion of people aged 65 and over with a long-term health problem or disability was 46 per cent for those who owned their property, 68 per cent for those in social rented accommodation and 56 per cent for those in private rented accommodation. 

Long-term health conditions by tenure

  • The 2011 Census showed that the proportion of people in households who lived in social rented accommodation was higher for those with one or more long-term health conditions (30 per cent) than for those with no such condition (18 per cent). This proportion was highest for people with a learning disability (52 per cent) and with a mental health condition (50 per cent).

Length of residence in the UK by tenure

  • In 2011, 7 per cent (348,000) of the 5.2 million people living in households in Scotland were born outside the UK. The proportion of these people living in private rented accommodation decreased with their length of residence in the UK: it was 75 per cent for people resident for less than two years decreasing to 14 per cent for people resident for ten years or more. Conversely, the proportion of people born outside the UK in households that owned their property increased with length of residence in the UK: it was 14 per cent for people resident for less than two years increasing to 71 per cent for people resident for ten years or more.

The tables of census results covered in Release 3J are listed below. They are a mixture of ‘Detailed Characteristics’ (DC) and ‘Local Characteristics’ (LC) tables. DC versions of tables include the most complex cross-tabulations and are therefore not available at smaller geographic areas (generally available down to postcode sectors). LC versions of tables include less complex cross-tabulations and are therefore available down to the lowest geographic levels (generally census output areas). In some instances, no LC version of a table is produced as a statistical disclosure control measure. Similarly, the DC version of some tables is produced for council areas only.

Tables included in Release 3J

DC2407SC Length of residence in the UK by tenure
LC2407SC Length of residence in the UK by tenure
DC3102SC General health by sex by age
LC3102SC General health by age
DC3103SC Provision of unpaid care by sex by age
DC3407SC Long-term health conditions by tenure
DC3501SC Long-term health conditions by highest qualification
DC3601SC General health by National Statistics Socio-economic Classification (NS-SeC) by sex by age
LC3601SC General health by National Statistics Socio-economic Classification (NS-SeC)
DC3602SC Long-term health problem or disability by National Statistics Socio-economic Classification (NS-SeC) by sex by age
LC3602SC Long-term health problem or disability by National Statistics Socio-economic Classification (NS-SeC) by age
DC4302SC Tenure by general health by long-term health problem or disability by age
LC4302SC Tenure by general health by long-term health problem or disability by age
DC4402SC Accommodation type by type of central heating in household by tenure
LC4402SC Accommodation type by type of central heating in household by tenure
DC4403SC Accommodation type by household spaces
LC4403SC Accommodation type by household spaces
DC4423SC Accommodation type by tenure by number of rooms by household size
LC4423SC Accommodation type by tenure by number of rooms by household size
DC4427SC Accommodation type by tenure - Households
LC4427SC Accommodation type by tenure - Households
DC4428SC Accommodation type by tenure - People
LC4428SC Accommodation type by tenure - People
DC6402SC National Statistics Socio-economic Classification (NS-SeC) by tenure
LC6402SC National Statistics Socio-economic Classification (NS-SeC) by tenure

All the data contained in this release can be accessed on the Scotland’s Census website.

Tags: 

Census 2011: Release 3I

Wednesday, 24 Sep 2014
Demography News Release -Image

Census 2011: Release 3I - Detailed characteristics on Labour Market and Education in Scotland

The statistics published today by the Registrar General for Scotland on the Scotland’s Census website present further details on labour market and education (Release 3I), from national to local level.

Key points - Release 3I

National Statistics Socio-economic Classification by sex by age

  • The National Statistics Socio-economic Classification (NS-SeC) provides an indication of the socio-economic position of people based on their occupation and employment status.
  • At the time of the 2011 Census, the largest NS-SeC group was ‘Lower managerial, administrative and professional occupations’ at 20 per cent (803,000) of the 4.0 million people aged 16 to 74 in Scotland. This proportion was highest for those aged 35 to 49 (25 per cent) and lowest for those aged 16 to 24 (6 per cent). It was 18 per cent for males and 23 per cent for females.
  • The NS-SeC group ‘Higher managerial, administrative and professional occupations’ accounted for 9 per cent of the population aged 16 to 74; it was 11 per cent for males and 6 per cent for females. The proportion was highest in the 35 to 49 age group for males (14 per cent) and the 25 to 34 age group for females (9 per cent)
  • The smallest NS-SeC group was ‘Small employers and own account workers’ at 7 per cent (295,000 people). This proportion was 11 per cent of males and 4 per cent of females. This proportion increased with age, rising from 1 per cent of those aged 16 to 24 to 10 per cent of those aged 50 to 74.
  • The ‘Never worked and long-term unemployed’ category represented 5 per cent (199,000) of the population aged 16 to 74. This proportion decreased with age: it was 8 per cent for those aged 16 to 24 and 4 per cent for those aged 50 to 64.

 National Statistics Socio-economic Classification by highest level of qualification by age

  • In 2011, over one quarter (27 per cent) of the 4.0 million people aged 16 to 74 in Scotland had achieved Census Level 4 (degree level) or above qualifications, while 23 per cent held no qualifications.
  • Nearly three-quarters (74 per cent) of the NS-SeC group ‘Higher managerial, administrative and professional occupations’ had achieved Census Level 4 or above qualifications with just 3 per cent holding no qualification.
  • Of those in the ‘Never worked and long-term unemployed’ category, just over half (51 per cent) held no qualifications while 8 per cent had achieved Census Level 4 or above qualifications. For those aged 16 to 24 these proportions were 33 per cent and 4 per cent respectively.

 Approximated Social Grade by sex by age

  • In 2011, almost one-third (31 per cent) of the 3.4 million people aged 16 to 64 living in households in Scotland had an approximated social grade of C1 (‘Supervisory, clerical junior management/administrative/professional’). The next most common category was DE (‘Semi-skilled and unskilled manual workers; on state benefit, unemployed, lowest grade workers’) at 26 per cent, followed by C2 (‘Skilled manual workers’) at 24 per cent. The AB category (‘Higher and intermediate managerial/administrative/professional’) was the smallest category at 19 per cent.
  • The proportion of males in the C1 category (30 per cent) was slightly lower than the proportion for females (33 per cent). The reverse applied for the C2 category, where the proportion for males (26 per cent) was higher than the proportion for females (21 per cent).
  • The proportion of people in the AB category was highest in the 30 to 39 age group at 23 per cent.

 Industry by ethnic group by age

  • In Scotland there were 2.5 million people aged 16 to 74 in employment the week before the 2011 Census. Of these people, 15 per cent worked in the ‘Retail activities’ sector and a further 15 per cent in the ‘Health and social work’ sector.
  • Relatively high proportions of the 56,000 people in the ‘Asian, Asian Scottish or Asian British’ ethnic group worked in the ‘Retail activities’ (21 per cent) and ‘Accommodation and food service activities’ sectors (20 per cent). These proportions were 15 per cent and 6 per cent respectively for all people aged 16 to 74 in employment.
  • While 15 per cent of all those aged 16 to 74 in employment worked in the ‘Health and social work’ sector, this proportion was 28 per cent for those in the ‘African’ ethnic group and 22 per cent for those in the ‘Caribbean or Black’ ethnic group. For people aged 50 to 64 in the ‘African’ and ‘Caribbean or Black’ ethnic groups, this proportion was 41 per cent and 31 per cent respectively.
  • The proportion of people in the ‘White’ ethnic group working in the ‘Manufacturing’ and ‘Construction’ sectors was 16 per cent. The corresponding proportion for minority ethnic groups was 6 per cent.

 Occupation by ethnic group by sex by age

  • In 2011, relatively high proportions of people in the minority ethnic groups were in ‘Professional occupations’ compared with those in the ‘White’ ethnic group, 25 per cent and 16 per cent respectively.
  • By contrast, relatively low proportions of people in the minority ethnic groups were employed in the occupation categories of ‘Administrative and secretarial occupations’ ( 7 per cent), ‘Skilled trade occupations’  (9 per cent) and ‘Process, plant and machine operatives’ (4 per cent). The corresponding proportions for people in the ‘White’ ethnic group were 12 per cent, 13 per cent and 8 per cent respectively.

 Economic Activity of full-time students by student accommodation by age

  • In 2011, 52 per cent of the 361,000 full-time students in Scotland aged 16 and over lived with their parents, 17 per cent lived in all-student households, 6 per cent lived alone, 15 per cent lived in other types of households (eg living with a partner, spouse or children) and 10 per cent lived in communal establishments such as university halls of residence.
  • The proportion of full-time students who lived with their parents varied considerably with age: it was 81 per cent for those aged 16 to 19, 32 per cent for those aged 20 to 24 and 10 per cent for those aged 25 and over.
  • All-student households was the most common type of accommodation for full-time students aged 20 to 24 (38 per cent), while for those aged 25 and over it was living in ‘other’ types of households (53 per cent).
  • Almost one third (32 per cent) of full-time students aged 16 and over were in employment, 9 per cent were economically active but unemployed and 59 per cent were economically inactive.

The tables of census results covered in Release 3I are listed below. They are a mixture of ‘Detailed Characteristics’ (DC) and ‘Local Characteristics’ (LC) tables. DC versions of tables include the most complex cross-tabulations and are therefore not available at smaller geographic areas (generally available down to postcode sectors). LC versions of tables include less complex cross-tabulations and are therefore available down to the lowest geographic levels (generally census output areas). In some instances, no LC version of a table is produced as a statistical disclosure control measure. Similarly, the DC version of some tables is produced for council areas only.


Tables included in Release 3I

DC6101SC National Statistics Socio-economic Classification (NS-SeC)by sex by age – Household Reference Persons (HRPs)
LC6101SC National Statistics Socio-economic Classification (NS-SeC) by age – Household Reference Persons (HRPs)
DC6102SC National Statistics Socio-economic Classification (NS-SeC) of Household Reference Person (HRP) by age and number of schoolchildren
DC6108SC Economic activity of full-time students by student accommodation by age
DC6111SC Former industry by sex by age
LC6111SC Former industry by age
DC6113SC Former occupation by sex by age
LC6113SC Former occupation by age
DC6114SC National Statistics Socio-economic Classification (NS-SeC) by sex by age
LC6114SC National Statistics Socio-economic Classification (NS-SeC) by age
DC6115SC National Statistics Socio-economic Classification (NS-SeC) of Household Reference Person (HRP) by household composition by sex
LC6115SC National Statistics Socio-economic Classification (NS-SeC) by household composition
LC6119SC Former Industry by sex
LC6121SC National Statistics Socio-economic Classification (NS-SeC) by sex
LC6123SC Former occupation by sex
DC6124SC Approximated social grade by sex by age
LC6124SC Approximated social grade by sex by age
DC6206SC National Statistics Socio-economic Classification (NS-SeC) by ethnic group by sex by age
LC6206SC National Statistics Socio-economic Classification (NS-SeC) by ethnic group
DC6211SC Industry by ethnic group by age
LC6211SC Industry by ethnic group
DC6213SC Occupation by ethnic group by sex by age
LC6213SC Occupation by ethnic group
DC6305SC Economic activity by unpaid carers by general health and provision of care
LC6305SC Economic activity by unpaid carers by general health and provision of care
LC6501SC Occupation by highest level of qualification
DC6606SC National Statistics Socio-economic Classification (NS-SeC) by economic activity by sex
LC6606SC National Statistics Socio-economic Classification (NS-SeC) by economic activity
DC6502SC National Statistics Socio-economic Classification (NS-SeC) by highest level of qualification by age
LC6502SC National Statistics Socio-economic Classification (NS-SeC) by highest level of qualification

All the data contained in this release can be accessed on the Scotland’s Census website.


Tags: 

Old Tom Morris’s Terrible Year

Tuesday, 23 Sep 2014
Old Tom Morris’s Terrible Year

The sad and fascinating tale of Scotland’s legendary golfing champions, Old Tom Morris and his son Young Tom, is revealed in a special display by the National Records of Scotland.

Inspired by the Ryder Cup teeing off in Scotland this year, archivists at NRS have pieced together the personal story of this Victorian golfing dynasty in St Andrews, starting in the year 1875, which brought them both professional success and personal loss.

The display complements the release of Valuation Rolls for the year 1875 on ScotlandsPeople, where Old and Young Tom Morris are just two of the hundreds of thousands of Victorian Scots who can be found. Drawing on these rolls, as well as on our records of births, deaths, marriages and wills, the the display tells the tale of Old Tom Morris and his family, ending with a revealing glimpse of his customers when he died in 1908.

The latest addition to ScotlandsPeople comprises over 900,000 index entries and almost 72,000 digital images taken from 141 volumes of Valuation Rolls.

Tim Ellis, Registrar General and Keeper of the Records of Scotland, said:
“The Morrises helped Scotland’s golfing reputation to grow across the world, and we are using the outstanding historical resources of the National Records of Scotland to mark the Ryder Cup with a tribute to two remarkable Scottish sportsmen.

The release of the Valuation Rolls for 1875 enables people worldwide to take a virtual peek into addresses throughout Scotland between 1841 and 1920 on the ScotlandsPeople website. This is part of the commitment of the National Records of Scotland to provide access to the key records that researchers want.”

The free display telling the story of ‘Old Tom Morris’s Terrible Year’ runs at General Register House, Edinburgh, 23 September – 31 October 2014, Monday to Friday 9:00 to 4:30.

Tags: 

Pages

Subscribe to RSS - 2014