National Records of Scotland

Preserving the past, Recording the present, Informing the future

2014

Number of Centenarians in Scotland Continues to Increase

Thursday, 25 Sep 2014
Demography News Release - Image

The number of people in Scotland living for more than a century continues to grow.

Figures published today by the National Records of Scotland, based on the 2011 Census, estimate that in 2013 there were 850 centenarians living in Scotland.

National Records of Scotland Chief Executive Tim Ellis said:

“The number of centenarians living in Scotland has been steadily rising, from 530 in 2003 to 850 in 2013, which is a growth of 60 per cent.

“In 2013 there were 18 male centenarians per hundred female centenarians, an increase from 13 in 2003, indicating a narrowing of the gap in mortality between men and women for this age group.

“Estimates of the number of people aged 90 to 99 show relatively big increases between 2010 and 2012. This is partly due to births in the years following the First World War being much higher than in the preceding years. The number of births in 1920 was the highest since the introduction of national registration in 1855.”

A century ago living to a hundred was very uncommon, but this changed at the beginning of the 21st Century when estimates showed there were over 500 people aged 100 years old and over in Scotland. The number of centenarians has been increasing ever since.

The overwhelming majority of centenarians are women. In 2013, women accounted for 720 of Scotland’s centenarians (85 per cent) while 130 men had reached the milestone. Although the male population aged 90 to 99 increased from 2012 to 2013, almost three quarters of people in their 90s are women (72 per cent).

Since 2003, the number of centenarians relative to the rest of the population has increased. But there are still less than 2 centenarians for every 10,000 people (1.6 per 10,000).


The full publication, Centenarians in Scotland, 2003 to 2013 , is available on the NRS website.

Tags: 

Finalists for 2014 Digital Preservation Awards Announced

Friday, 12 Sep 2014
Image of Archives Building

The Digital Preservation Coalition (http://www.dpconline.org) have announced the thirteen finalists for the Digital Preservation Awards 2014. These awards, established in 2004, celebrate significant and innovative contributions by individuals and organisations in the field of digital preservation. There are four categories of award:

  • The Open Planets Foundation (http://openplanetsfoundation.org/) Award for Research and Innovation which recognises excellence in practical research and innovation activities.
  • The Nationale Coalitie Digitale Duurzaamheid (http://ncdd.nl/) Award for Teaching and Communications, recognising excellence in outreach, training and advocacy.
  • The DPC Award for the Most Distinguished Student Work in Digital Preservation, encouraging and recognising student work in digital preservation.
  • The DPC Award for Safeguarding the Digital Legacy, which celebrates the practical application of preservation tools to protect at-risk digital objects.

NRS’s Deputy Keeper of the Records of Scotland Laura Mitchell, who is Chair of the DPC, said: ‘In its early years, the Digital Preservation Award was a niche category in the Conservation Awards. But year on year the judges have been impressed by the increasing quality, range and number of nominations. I’m delighted to report that, once again, we have had a record number of applications which demonstrate an incredible depth of insight and subtlety in approach to the thorny question of how to make our digital memory accessible tomorrow. ’

The DPC will shortly issue instructions to its members on how to vote.

For more information please see the DPC’s news release.

Tags: 

Births, Deaths and Other Vital Events - Second Quarter 2014

Thursday, 11 Sep 2014
Demography News Release - Image

Provisional figures for births, deaths and other vital events registered during the second quarter of 2014 are published today by the National Records of Scotland.

The release presents provisional figures for vital events which were registered in Scotland in the period from 1 April 2014 to 30 June 2014, inclusive. The tables and chart provide statistics of births, stillbirths, marriages, civil partnerships and deaths, including:

  • quarterly figures for Scotland for each of the past ten years;
  • the totals for each Local Authority and NHS Board area for the latest quarter; and
  • more detailed analyses of the numbers of deaths (e.g. cross-classified by sex, cause and NHS Board area) for the latest quarter.

The full publication, Births, deaths and other vital events - quarterly figures, is available on this website

Tags: 

Keeper’s Public Records (Scotland) Act 2011 Annual Report

Friday, 22 Aug 2014
Keeper’s Public Records (Scotland) Act 2011 Annual Report

The Keeper’s second Annual Report on the Public Records (Scotland) Act 2011 has now been laid before the Scottish Parliament and published.

It can be viewed on the National Records of Scotland (NAS) website.

The report shows that 67 scheduled public authorities have been invited to submit their records management plans and many had them agreed in 2013/14. The Act is central to a long-term process of improving the standard of record-keeping across the Scottish public sector. Those invited have submitted robust plans which reflect and promote good practice. Experience suggests that authorities have accepted and embraced the benefits of the legislation and are taking it seriously. There is also firm evidence of a willingness and enthusiasm to collaborate, both with the Keeper and across different sectors, to share experience, knowledge, and extend best practice.

Tags: 

Scotland’s Changing Population

Thursday, 14 Aug 2014
Demography News Release - Image

Registrar General’s annual review of demographic trends published

National Records of Scotland (NRS) today publishes ‘Scotland’s Population 2013 – the Registrar General’s Annual Review of Demographic Trends’. It is accompanied by a wide range of other statistics on births, stillbirths, adoptions, marriages, civil partnerships, deaths and life expectancy, which appear in the Vital Events Reference Tables, in ‘Drug-related Deaths in Scotland in 2013’, and in website sections on deaths from certain causes and national life tables.

The report is a compendium that brings together key demographic information from a range of publications produced by NRS. It has been produced annually since it was first published in 1855. It also includes an infographics supplement for the first time.

The Registrar General’s Annual Review of Demographic Trends shows that:

  • The estimated population of Scotland on 30 June 2013 was 5,327,700, the highest ever.
  • There were 56,014 births registered in Scotland in 2013. This was 2,013 (3.5 per cent) fewer births than in 2012. There were 54,700 deaths registered in Scotland in 2013. This was 237 (0.4 per cent) less than in 2012.
  • In the year to 30 June 2013, 75,900 people came to Scotland (from the rest of the UK and from overseas) and 65,900 left Scotland (to the rest of the UK and overseas). This gives a net-gain of 10,000 which is lower than previous years.
  • There were 27,547 marriages in Scotland in 2013. The average age at which people marry for the first time has increased by around two years since 2003, to 33.0 years for men and 31.2 years for women.
  • In 2013, there were 489 adoptions recorded in Scotland. The number of adoptions each year is around a quarter of what it used to be in the early 1970s.
  • In mid-2013, there were 2.4 million households in Scotland, which is an increase of around 171,000 over the past ten years.

The number of households in Scotland is projected to increase

Infographic - The number of households in Scotland is projected to increase

Among the other information published by NRS today is that there were, in 2013:

  • 1,100 alcohol-related deaths, 20 (2 per cent) more than in 2012;
  • 526 drug-related deaths, 55 (9 per cent) fewer than in 2012;
  • 795 probable suicides, 35 (4 per cent) fewer than in 2012.

The full publications Scotland's Population 2013 - The Registrar General's Annual Review of Demographic Trends and Drug-Related Deaths in Scotland in 2013 are available on the NRS website.


Tags: 

Census 2011: Release 3H

Wednesday, 13 Aug 2014
Demography News Release - Image

Census 2011: Release 3H - Detailed characteristics on Labour Market and Transport in Scotland

 The statistics published today by the Registrar General for Scotland on the Scotland’s Census website present further details on labour market and education (Release 3G), from national to local level.

 Key points - Release 3H

 Industry by sex by age

  • 2.5 million people between the ages of 16 and 74 reported they were in employment in the week before the census.
  • ‘Health and social work’ and ‘Retail activities’ were the largest two industry sectors at the time of the 2011 Census, each accounting for 15 per cent (377,000) of people aged 16 to 74 in employment.
  • 90 per cent (145,000) of those who were employed in ‘Construction’ were male. In contrast, 80 per cent (303,000) of people who worked in ‘Health and social work’ were female.
  • The proportion of people in employment in ‘Retail activities’ increased with age: it was 35 per cent of those aged 16 to 19 but 12 per cent of those aged 45 to 64.

Hours worked by sex by age

  • In 2011, of the 2.5 million people aged 16 to 74 in employment the week before the census,  28 per cent (706,000) were employed part time (30 hours or less a week).
  • The proportion who worked on a part time basis was highest for those aged 16 to 21 (55 per cent) and aged 65 to 74 (46 per cent).
  • Full time employment was highest amongst the 25 to 29 age group, at 79 per cent (209,000) of all people in employment.
  • The proportion of people aged 16 to 74 in employment who worked on a part time basis was much higher for females than males, 44 per cent and 13 per cent respectively.

Occupation by economic activity by sex

  • Of the 2.5 million people in Scotland aged 16 to 74 in employment, 88 per cent (2.2 million) were employees, 9 per cent (219,000) were self-employed without employees and 3 per cent (83,000) were self-employed with employees of their own.
  • The three occupations with the highest proportion of the working population were ‘Professional occupations’ (17 per cent), ‘Associate professional and technical occupations’ (13 per cent) and ‘Skilled trades occupations’ (13 per cent).
  • The vast majority of those who worked in ‘Sales and customer service occupations’ were employees (98 per cent or 229,000). Conversely, those who worked in ‘Skilled trade occupations’ had the highest proportion of self employment (27 per cent or 87,000).
  • 82 per cent (201,000) of all people who worked in ‘Caring, leisure and other service occupations’ were female whilst 90 per cent (284,000) of those who worked in ‘Skilled trades occupations’ were male.

Method of travel to place of work or study by sex by age

  • Of the 2.1 million people who travelled to work aged 16 to 74 (excluding those who worked mainly from home), 69 per cent (1.5 million) went by car or van. This included 63 per cent (1.3 million) who drove and 6 per cent (139,000) who were passengers. The next most common modes of transport, each accounting for 11 per cent,  were travelling by bus, minibus or coach (241,000) and on foot (238,000).
  • Just under three-quarters (73 per cent) of people aged 35 to 74 travelled to work by car or van (including 67 per cent who drove and 6 per cent who were passengers) whilst 57 per cent of those aged 16 to 24 did so.
  • Of the 872,000 people aged 4 and over studying the week before the census (excluding those who study mainly from home), almost half (45 per cent or 390,000 people) travelled to their place of study on foot.
  • Over half (55 per cent) of children aged 4 to 11 walked to their place of study, while 31 per cent went as a passenger in a car or van and 11 per cent travelled by bus, minibus or coach. For children aged 12 to 17, similar proportions walked to their place of study (40 per cent) or travelled by bus, minibus or coach (38 per cent). For those aged 18 and over, the proportion who travelled to their place of study on foot was 34 per cent, compared with 27 per cent who travelled by bus, minibus or coach and 23 cent who travelled by car or van. 

The tables of census results covered in Release 3H are listed below. They are a mixture of ‘Detailed Characteristics’ (DC) and ‘Local Characteristics’ (LC) tables. DC versions of tables include the most complex cross-tabulations and are therefore not available at smaller geographic areas (generally available down to postcode sectors). LC versions of tables include less complex cross-tabulations and are therefore available down to the lowest geographic levels (generally census output areas). In some instances, no LC version of a table is produced as a statistical disclosure control measure. Similarly, the DC version of some tables is produced for council areas only. 

Tables included in Release 3H

Table Number Table Name
LC5601SC Highest level of qualification by economic activity
DC6109SC Hours worked by sex by age
LC6109SC Hours worked by sex by age
DC6110SC Industry by sex by age
LC6110SC Industry by age
DC6112SC Occupation by sex by age
LC6112SC Occupation by age
DC6116SC Year last worked by sex by age
LC6116SC Year last worked by age
LC6118SC Industry by sex
LC6120SC Occupation by sex
LC6122SC Year last worked by sex
LC6128SC Economic activity by sex
DC6501SC Occupation by highest level of qualification by age
DC6601SC Occupation by economic activity by sex
LC6601SC Occupation by economic activity
DC6604SC Occupation by industry
DC6605SC Occupation by hours worked by sex
LC6605SC Occupation by hours worked
DC6602SC Industry by economic activity
LC6602SC Industry by economic activity
DC7101SC Method of travel to work by sex by age
DC7104SC Method of travel to study by age
DC7604SC National Statistics Socio-economic Classification (NS-SeC) by method of travel to work or study by sex


All the data contained in this release can be accessed on the Scotland’s Census website.


Tags: 

Scotland’s People and the First World War

Thursday, 14 Aug 2014
Scotland’s People and the First World War - Image

 To mark the centenary of the outbreak of war on 4 August 1914, National Records of Scotland presents a free archive display that highlights some of the demographic changes that occurred before, during and after the conflict. The story of one family reveals some of the individuals behind the official statistics at the time by the Registrar General for Scotland. The display coincides with the publication of The Registrar General’s Annual Review of Demographic Trends.

The free display is open in General Register House, 14 August – 19 September (except for 15 September) Monday to Friday 9:00 to 4:30.

Tags: 

Household Numbers Projected to Rise with Nearly a Quarter of Adults Living Alone by 2037

Wednesday, 30 Jul 2014
Demography News Release - Image

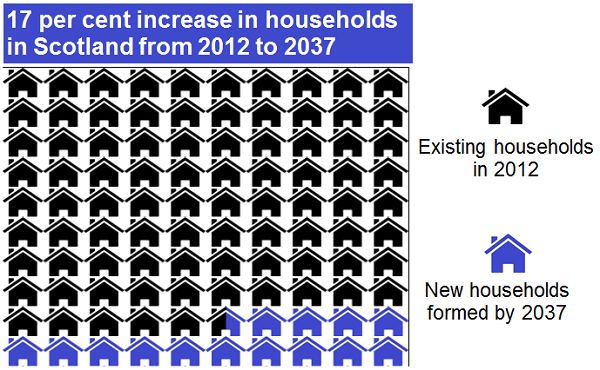
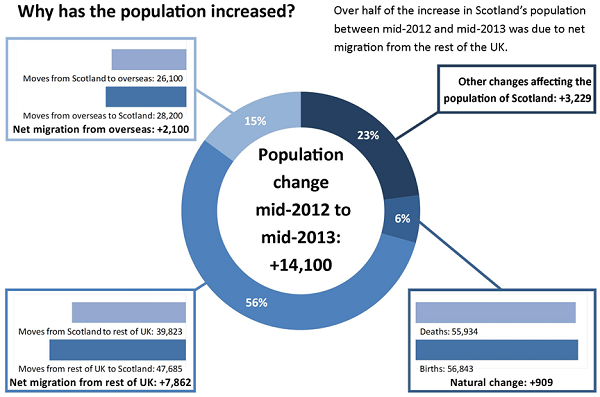
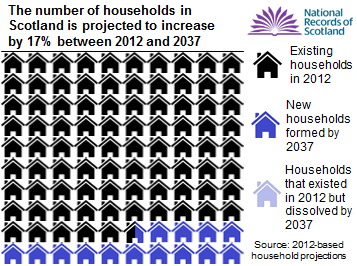
Figures published today by the National Records of Scotland (NRS) show that the total number of households in Scotland is projected to increase by a sixth over the next 25 years to 2.78 million. Nearly a quarter of people aged 16 or over are projected to live alone by 2037, compared to about one in five in 2012. The number of people aged 65 and over living alone is projected to rise by a half, whilst the numbers more than double for those aged 85 or over.

Infographic - shows  increase in households in Scotland from 2012 to 2037

Tim Ellis, the Chief Executive of National Records of Scotland, said:

“The number of households in Scotland is projected to grow by nearly 400,000 over the next 25 years. Most of this increase is in the older age groups. Scotland’s population is growing, but the number of households is increasing faster, due to changes in the types of households people are living in, and the ageing population.”

The figures also show that one-adult households are projected to increase by 300,000 over the next 25 years. There are smaller increases in households containing one adult with children (+41,000), and those containing just two adults (+139,000). In contrast, the number of larger households is projected to fall
(-84,000).

The biggest increases are among older households, due to Scotland’s ageing population. Older people are more likely than younger people to live alone. In 2037, it is projected that there will be 46,100 men aged 85+ living alone in Scotland, and 108,000 women.

However, the rate of household growth is slower than it used to be. For example, figures from Scotland’s census show that more young adults aged 20 to 34 are living with their parents instead of forming new households. This is probably due to it being more difficult for them to afford to set up homes of their own.

Infographic - shows more deprived areas contain more one-adult households, and fewer two -adult hosuseholds,

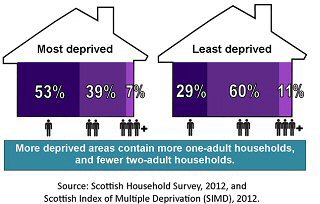
There tend to be more one-adult households (with or without children) in the most deprived areas, and more two-adult households in less deprived areas. More deprived areas also tend have a higher density of housing, more flats, and more dwellings in the lower value Council Tax bands.

Across Scotland, 2.8 per cent of dwellings are vacant and 1.4 per cent are second homes. These figures are much higher in remote rural areas (4.9 and 6.8 per cent respectively).

Council areas

Most Council areas are projected to have an increase in the number of households over the next 25 years, with the City of Edinburgh and Aberdeen City having the largest increases at 39 and 35 per cent respectively. The three Council areas where the number of households is projected to fall are North Ayrshire, Argyll and Bute and Inverclyde, with decreases of one, six and ten per cent respectively.

The full publications Household Projections for Scotland, 2012-based and Estimates of Households and Dwellings in Scotland, 2013 are available on the NRS website.

Tags: 

Census 2011: Release 3G

Wednesday, 23 Jul 2014
Census 2011: Release 3G

Census 2011: Release 3G - Detailed characteristics on Labour Market and Education in Scotland 

The statistics published today by the Registrar General for Scotland on the Scotland’s Census website present further details on labour market and education (Release 3G), from national to local level.

Key points - Release 3G

Economic activity by sex by age

  • Of the total of 4.4 million people aged 16 and over in Scotland at the time of the 2011 Census, 63 per cent (2.8 million) were classed as ‘Economically Active’ (in employment, or looking for work). This proportion ranged from 53 per cent for people aged between 16 and 19, to 85 per cent for those aged between 25 and 54.

  • Females were more likely to be working part-time: of the economically active population, 12 per cent of males and 41 per cent of females were in part-time employment. Conversely, 79 per cent of economically active males and 52 per cent of economically active females were in full-time employment.

  • There was also clear gender difference in the proportion of the population aged 16 and over who were economically inactive because they looking after their home or family: 6 per cent for females (including 11 per cent for females aged 35 to 39) compared with less than 1 per cent for males.

Economic activity by provision of unpaid care by general health

  • In 2011, 79 per cent of people aged 16 and over stated that their general health was either ‘Very Good’ or ‘Good’. Almost three-quarters of these people (72 per cent or 2.5 million people) were classed as ‘Economically Active’. Of the total population of people who provided a high number of hours (35 or more) unpaid care per week, 34 per cent (59,000) were retired, 31 per cent (52,000) were employees and 16 per cent (28,000) were looking after their home or family.

Highest level of qualification* by sex by age

  • Of the 4.4 million people in Scotland aged 16 and over, just over a quarter (1.1 million people) held Census Level 4 or above qualifications, such as a university degree, while just over another quarter (1.2 million people) indicated that they had no qualifications.

  • Older people tended to have fewer qualifications: 60 per cent of those aged 65 and over (531,000) stated that they had no qualifications compared with 8 per cent of those aged 16 to 34 (105,000).

  • 39 per cent of people aged 25 to 34 (262,000) stated they held Census Level 4 or above qualifications, compared with 18 per cent of those aged 65 and over (161,000).

  • A slightly higher proportion of females (27 per cent) than males (26 per cent) had no qualifications. However, a slightly higher proportion of females (27 per cent) than males (25 per cent) held Census Level 4 or above qualifications.

Highest level of qualification* by ethnic group

  • Out of the six broad ethnic groups (White, Asian, Mixed or multiple, African, Caribbean and Black, Other ethnic groups), the ‘African’ ethnic group category had the highest proportion of highly qualified people: 55 per cent (12,000) of people aged 16 and above held Census Level 4 or above qualifications. The next highest proportion was for the ‘Other Ethnic Groups’ category, at 53 per cent (6,000 people). The ‘White’ ethnic group category had the lowest proportion of people aged 16 and over with Census Level 4 or above qualifications, at 25 per cent (1.1 million).

  • Within the ‘White’ ethnic group population, the sub-group with the lowest proportion of people aged 16 and over with Census Level 4 or above qualifications was ‘White: Scottish’, at 22 per cent (811,000), and the sub-group with the highest proportion was ‘White: Other’ (which includes ‘White: Gypsy/Traveller’, ‘White: Polish’ and ‘White: Other White’) at 50 per cent (71,000).

Highest level of qualification by length of residence in the UK

  • People who had arrived more recently in the UK were generally more highly qualified than those who were either born in the UK, or who had been resident in the UK for 10 years or more. For example, 8 per cent (6,000 people) of those aged 16 and over who had been resident in the UK for less than two years had no qualifications compared with 28 per cent (1.1 million people) of those born in the UK.

The tables of census results covered in Release 3G are listed below. They are a mixture of ‘Detailed Characteristics’ (DC) and ‘Local Characteristics’ (LC) tables. DC versions of tables include the most complex cross-tabulations and are therefore not available at smaller geographic areas (generally available down to postcode sectors). LC versions of tables include less complex cross-tabulations and are therefore available down to the lowest geographic levels (generally census output areas). In some instances, no LC version of a table is produced as a statistical disclosure control measure. Similarly, the DC version of some tables is produced for council areas only.

* Highest level of qualifications

Brief descriptions of the categories for highest level of qualification are given below (more detailed descriptions are available on the Scotland’s Census website). These categories differ from those used in other published statistics, in particular those based on the Scottish Credit and Qualifications Framework (SCQF).

No qualifications


Census Level 1:

Standard Grade (at foundation, general or credit) or equivalent qualifications

Census Level 2:

Higher, Advanced Higher or equivalent qualifications

Census Level 3:

SVQ level 4 or equivalent qualifications

Census Level 4 and above:

First or higher degree, professional qualifications, or other equivalent higher education qualifications

Tables included in Release 3G

Table Number

Table name

LC5102SC

Highest level of qualification by sex by age

LC5202SC

Highest level of qualification by ethnic group

LC5802SC

Highest level of qualification by length of residence in the UK

LC6107SC

Economic activity by age

LC6201SC

Economic activity by ethnic group

LC6301SC

Economic activity by provision of unpaid care by general health

LC6302SC

Economic activity by long-term health problem or disability

LC6401SC

Economic activity by living arrangements

DC3603SCca

Long-term health conditions by economic activity

DC4111SC

Tenure by age of Household Reference Person (HRP)

DC4112SC

Living arrangements of young adults by sex

DC5102SC

Highest level of qualification by sex by age

DC5202SC

Highest level of qualification by ethnic group by age

DC5601SC

Highest level of qualification by economic activity by age

DC5802SC

Highest level of qualification by length of residence in the UK

DC6107SC

Economic activity by sex by age

DC6201SC

Economic activity by ethnic group by sex by age

DC6301SC

Economic activity by provision of unpaid care by general health

DC6302SC

Economic activity by long-term health problem or disability

DC6401SC

Economic activity by living arrangements

All the data contained in this release can be accessed on the Scotland’s Census website.

Tags: 

Further Information on Scotland’s Population Published Today

Thursday, 26 Jun 2014
Demography News Release - Image

Statistics published today by the National Records of Scotland (NRS) show that between mid-2012 and mid-2013 the populations of 20 Council areas in Scotland increased while the populations of the remaining 12 decreased or remained the same. The data also shows that the age structure of Scotland’s population varies across the country – overall, the median age (the age at which half the population is older and half is younger) of the population in Scotland was 41, but this ranged from 36 in big city areas to 47 in more rural Council areas. Today’s statistics break down further the headline figures published 30 April 2014 on this website showed that the estimated population of Scotland was 5,327,700 in mid-2013, the highest ever and an increase of 14,100 on the previous year.

Main findings

Scotland

  • The estimated population of Scotland on 30 June 2013 was 5,327,700, the highest ever and an increase of 14,100 from the previous year.
  • There were approximately 2,586,530 males and 2,741,170 females.
  • The population increased because approximately 910 more people were born than died, and because the number of people coming into Scotland exceeded the number leaving by approximately 9,960 between mid-2012 and mid-2013. Other changes, such as in armed forces and prisoners, resulted in a gain of approximately 3,230 people. Infographic 1 provides more information on why Scotland’s population has increased.

Infographic 1

Infographic 1 - Why has population increased? - Image


Age of migrants arriving in Scotland

  • Migrants to Scotland tended to be younger than the general population. Of in-migrants to Scotland, 49 per cent from the rest of the UK and 69 per cent of those from overseas were aged 16-34 years, yet in the resident population only 25 per cent were in this age group.
  • Only six per cent of people coming to Scotland from the rest of the UK and two per cent of people entering from overseas were aged 65 and over. Scotland had a net gain of UK migrants in every age group, except those aged 25-34 and 75-84, and a net loss of international migrants for all ages over 25.

Age structure of Scotland’s population varies across the country

  • The median age (the age at which half the population is older and half is younger) of the population in Scotland was 41.
  • The median age was lower in big city areas than in more rural Council areas. For example, the median age was 36 in Aberdeen City, the City of Edinburgh and Glasgow City and 47 in Argyll & Bute and Dumfries & Galloway.

The population of 20 Council areas have increased and 12 have decreased or remained the same

  • Among Council areas, between mid-2012 and mid-2013, Moray had the largest percentage population increase at +1.5 per cent, followed by Argyll & Bute (+1.3 per cent) and the City of Edinburgh and Aberdeen City (+1.0 per cent). West Dunbartonshire and Eilean Siar had the largest percentage population decrease at -0.6 per cent, followed by North Ayrshire and Inverclyde and (-0.5 per cent) and Dumfries & Galloway (-0.4 per cent).
  • The populations of the City of Edinburgh and Aberdeen City increased because of more births than deaths and net in-migration. (The populations in Moray and Argyll & Bute increased primarily because of other changes such as changes in the number of armed forces.) In contrast, the populations of West Dunbartonshire, North Ayrshire and Inverclyde decreased because of more deaths than births and net out-migration. The populations in Eilean Siar and Dumfries & Galloway decreased primarily because of more deaths than births.
  • On average, in mid-2013 there were 68 people per square kilometre in Scotland, ranging from 9 people per square kilometre in Eilean Siar and Highland to 3,415 people per square kilometre in Glasgow City Council area.

The full publication Mid-2013 Population Estimates Scotland is available on the NRS website.

Tags: 

Pages

Subscribe to RSS - 2014